CBSE 10th Standard Maths Subject Statistics Case Study Questions With Solution 2021
By QB365
QB365 Provides the updated CASE Study Questions for Class 10 Maths, and also provide the detail solution for each and every case study questions . Case study questions are latest updated question pattern from NCERT, QB365 will helps to get more marks in Exams
QB365 - Question Bank Software
CBSE 10th Standard Maths Subject Statistics Case Study Questions With Solution 2021
10th Standard CBSE
-
Reg.No. :
Maths
-
An agency has decided to install customised playground equipments at various colony parks. For that they decided to study the age-group of children playing in a park of the particular colony. The classification of children according to their ages, playing in a park is shown in the following table
Age group of children (in years) 6-8 8-10 10-12 12-14 14-16 Number of children 43 58 70 42 27 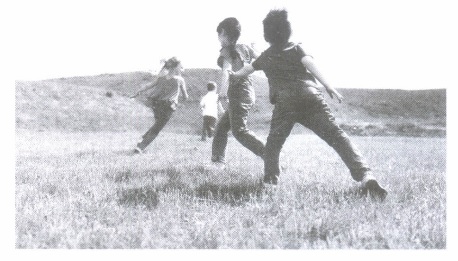
Based on the above information, answer the following questions.
(i) The maximum number of children are of the age-group(a) 12-14 (b) 10-12 (c) 14-16 (d) 8-10 (ii) The lower limit of the modal class is
(a) 10 (b) 12 (c) 14 (d) 8 (iii) Frequency of the class succeeding the modal class is
(a) 58 (b) 70 (c) 42 (d) 27 (iv) The mode of the ages of children playing in the park is
(a) 9 years (b) 8 years (c) 11.5 years (d) 10.6 years (v) If mean and mode of the ages of children playing in the park are same, then median will be equal to
(a) Mean (b) Mode (c) Both (a) and (b) (d) Neither (a) nor (b) (a) -
On a particular day, National Highway Authority ofIndia (NHAI) checked the toll tax collection of a particular toll plaza in Rajasthan.
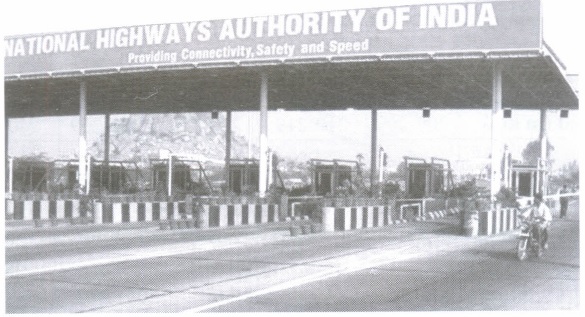
The following table shows the toll tax paid by drivers and the number of vehicles on that particular day.Toll tax (in Rs) 30-40 40-50 50-60 60-70 70-80 Number of vehicles 80 110 120 70 40 Based on the above information, answer the following questions.
(i) If A is taken as assumed mean, then the possible value of A is(a) 32 (b) 42 (c) 85 (d) 55 (ii) If xi's denotes the class marks and fi's denotes the deviation of assumed mean (A) from xi's, then the minimum value of |di| is
(a) -200 (b) -100 (c) 0 (d) 100 (iii) The mean of toll tax received. by NHAI by assumed mean method is
(a) Rs 52 (b) Rs 52.14 (c) Rs 52.50 (d) Rs 53.50 (iv) The mean of toll tax received by NHAI by direct method is
(a) equal to the mean of toll tax received by NHAI by assumed mean method (b) greater than the mean of toll tax received by NHAI by assumed mean method (c) less than the mean of toll tax received by NHAI by assumed mean method (d) none of these (v) The average toll tax received by NHAI in a day, from that particular toll plaza, is
(a) Rs 21000 (b) Rs 21900 (c) Rs 30000 (d) none of these (a) -
Transport department of a city wants to buy some Electric buses for the city. For which they wants to analyse the distance travelled by existing public transport buses in a day.
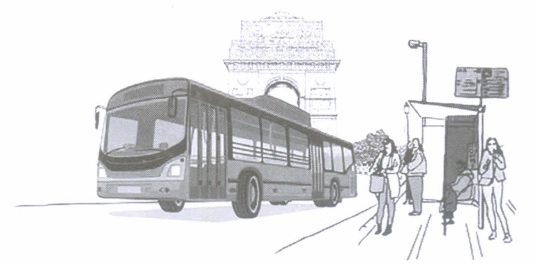
The following data shows the distance travelled by 60 existing public transport buses in a day.Daily distance travelled (in km) 200-209 210-219 220-229 230-239 240-249 Number of buses 4 14 26 10 6 Based on the above information, answer the following questions.
(i) The upper limit of a class and lower limit of its succeeding class is differ by(a) 9 (b) 1 (c) 10 (d) none of these (ii) The median class is
(a) 229.5-239.5 (b) 230-239 (c) 220-229 (d) 219.5-229.5 (iii) The cumulative frequency of the class preceding the median class is
(a) 14 (b) 18 (c) 26 (d) 10 (iv) The median of the distance travelled is
(a) 222 km (b) 225 km (c) 223 km (d) none of these (v) If the mode of the distance travelled is 223.78 km, then mean of the distance travelled by the bus is
(a) 225 km (b) 220 km (c) 230.29 km (d) 224.29 km (a) -
An electric scooter manufacturing company wants to declare the mileage of their electric scooters. For this, they recorded the mileage (km/ charge) of 50 scooters of the same model. Details of which are given in the following table.
Mileage (km/charge) 100-120 120-140 140-160 160-180 Number of scooters 7 12 18 13 
Based on the above information, answer the following questions.
(i) The average mileage is(a) 140 krn/charge (b) 150 krn/ charge (c) 130 krn/charge (d) 144.8 krn/charge (ii) The modal value of the given data is
(a) 150 (b) 150.91 (c) 145.6 (d) 140.9 (ill) The median value of the given data is
(a) 140 (b) 146.67 (c) 130 (d) 136.6 (iv) Assumed mean method is useful in determining the
(a) Mean (b) Median (c) Mode (d) All of these (v) The manufacturer can claim that the mileage for his scooter is
(a) 144 krn/charge (b) 155 krn/charge (c) 165 krn/charge (d) 175krn/charge (a) -
Household income in India was drastically impacted due to the COVID-19 loekdown. Most of the companies decided to bring down the salaries of the employees by 50%.
The following table shows the salaries (in percent) received by 25 employees during loekdown.Salaries received (in percent) 50-60 60-70 70-80 80-90 Number of employees 9 6 8 2 
Based on the above information, answer the following questions.
(i) Total number of persons whose salary is reduced by more than 30%, is(a) 10 (b) 20 (c) 25 (d) 15 (ii) Total number of persons whose salary is reduced by atmost 40%, is
(a) 15 (b) 10 (c) 16 (d) 8 (iii) The modal class is
(a) 50-60 (b) 60-70 (c) 70-80 (d) 80-90 (iv) The median class of the given data is
(a) 50-60 (b) 60-70 (c) 70-80 (d) 80-90 (v) The empirical relationship between mean, median and mode is
(a) 3 Median = Mode + 2 Mean (b) 3 Median = Mode - 2 Mean (c) Median = 3 Mode - 2 Mean (d) Median = 3 Mode + 2 Mean (a)
Case Study Questions


