
 100% FREE ACCESS
10th Standard CBSE Syllabus & Materials
10th Standard CBSE
CBSE 10th Social Science ECO - Globalisation and the Indian Economy - New Model Questions Papers Study Material - QB365 Set A
NEW10th Standard CBSE
CBSE 10th Social Science ECO - Money and Credit - New Model Questions Papers Study Material - QB365 Set A
NEW10th Standard CBSE
CBSE 10th Social Science ECO - Sectors of the Indian Economy - New Model Questions Papers Study Material - QB365 Set A
NEW10th Standard CBSE
CBSE 10th Social Science ECO - Development - New Model Questions Papers Study Material - QB365 Set A
NEW10th Standard CBSE
CBSE 10th Social Science PS - Outcomes of Democracy - New Model Questions Papers Study Material - QB365 Set A
NEW10th Standard CBSE
CBSE 10th Social Science PS - Gender, Religion and Caste - New Model Questions Papers Study Material - QB365 Set A

Published on: 26/10/2025
Download CBSE Class 10th Standard CBSE Maths question papers, sample papers, important questions, and previous year solved papers in PDF format. Get free study materials, NCERT solutions, and exam preparation resources for Class 10th Standard CBSE Maths
Questions + Answers key
Take MCQ Maths Test
1.
A solid is in the shape of a right-circular cone surmounted on a hemisphere, the radius of each of them being 7 cm and the height of the cone is equal to its diameter. Find the volume of the solid \(\left[\text { use } \pi=\frac{22}{7}\right]\)
2.
The marks obtained by 30 students of Class X of a certain school in a Mathematics paper consisting of 100 marks are presented in table below:
| Class interval | 10-25 | 25-40 | 40-55 | 55-70 | 70-85 | 85-100 |
| Number of students | 2 | 3 | 7 | 6 | 6 | 6 |
Find the mean of the marks obtained by the students,
3.
Find the mode of the following data
| Marks | Below 10 | Below 20 | Below 30 | Below 40 | Below 50 |
| Number of students | 8 | 20 | 45 | 58 | 70 |
4.
If the median for the following frequency distribution is 28.5, find the value of x and y
| Class | Frequencies |
| 0-10 | 5 |
| 10-20 | x |
| 20-30 | 20 |
| 30-40 | 15 |
| 40-50 | y |
| 50-60 | 5 |
5.
Find the median of the following data:
| Height (in cm) | Less than 120 | Less than 140 | Less than 160 | Less than 180 | Less that 200 |
| Number of students | 12 | 26 | 34 | 40 | 50 |
6.
If median=137 units and mean=137.05 units, then find the mode.
7.
The following frequency distribution gives the monthly consumption of electricity of 68 consumers of a locality. Find (i) median, (ii) mean and (iii) mode of the data and compare them. (iv) How electricity consumption can be reduced?
| Monthly consumption (in units) | Number of consumers |
| 65-85 | 4 |
| 85-105 | 5 |
| 105-125 | 13 |
| 125-145 | 20 |
| 145-165 | 14 |
| 165-185 | 8 |
| 185-205 | 4 |
8.
Find the unknown entries a, b, c, d, e and f in the following and hence find their mode.
| Height (in cm) | 150-155 | 155 - 160 | 160 - 165 | 165 - 170 | 170-175 | 175-180 | Total |
| Frequency | 12 | b | 10 | d | e | 2 | 50 |
| Cumulative Frequency |
9 | 25 | c | 43 | 48 | f |
9.
A health officer took an initiative of organising a medical camp in a remote village. The medical checkup of 35 students of the age group of 10 yr and their weights were recorded as follows:
| Weight (in kg) | Number of students |
|---|---|
| 38-40 | 3 |
| 40-42 | 2 |
| 42-44 | 4 |
| 44-46 | 5 |
| 46-48 | 14 |
| 48-50 | 4 |
| 50-52 | 3 |
(i) Find the mean weight of students using step deviation method.
(ii) Which value of health officer was depicted in this situation?
10.
The following table gives the distribution of the life time of 400 neon lamps :
| Lifetime (in hours) | Number of lamps |
|---|---|
| 1500-2000 | 14 |
| 2000-2500 | 56 |
| 2500-3000 | 60 |
| 3000-3500 | 86 |
| 3500-4000 | 74 |
| 4000-4500 | 62 |
| 4500-5000 | 48 |
Find the median lifetime of a lamp.
11.
Find the mode of the following distribution
| Classes | 25-30 | 30-35 | 35-40 | 40-45 | 45-50 | 50-55 |
|---|---|---|---|---|---|---|
| Frequency | 25 | 34 | 50 | 42 | 38 | 14 |
12.
Consider the following distribution:
| Marks Obtained | 0 or More | 10 or More | 20 Or More | 30 Or More | 40 Or More | 50 Or More |
| Number of students | 63 | 58 | 55 | 51 | 48 | 42 |
(i) Calculate the frequency of the class 30 - 40.
(ii) Calculate the class mark of the class 10 - 25
13.
Calculate mode of the following data.
| Marks obtained | 0-20 | 20-40 | 40-60 | 60-80 | 80-100 |
|---|---|---|---|---|---|
| Number of students | 8 | 10 | 12 | 6 | 3 |
14.
If xi 's are the mid-points of the class intervals of grouped data, f 1's are corresponding frequencies and \(\overline { x } \) is the mean, find the value of \(\sum { \left( f_{ i }x_{ i }-\overline { x } \right) } \).
15.
If \(u_{ i }=\frac { x_{ i }-20 }{ 10 } ,\quad \sum { f_{ i }u_{ i }=30 } \) and \(\sum { f_{ i }=40 } \) , find the value of \(\overline { x } \) .
16.
For the following distribution
| Class | 0-5 | 5-10 | 10-15 | 15-20 | 20-25 |
| Frequency | 10 | 15 | 12 | 20 | 9 |
The lower limit of modal class is
15
25
30
35
17.
If the mean of 6, 7, x, 8, y, 14 is 9, then
x + y = 21
x + y = 19
x - y = 19
x - y = 21
18.
If the mean of five observations x, x + 2, x + 4, x + 6 and x + 8 is 11, then the values of x is
4
7
11
6
19.
If for a distribution \(\sum_1^n f_i x_i=132+5 p, \sum_1^n f_i=20\) and mean of the distribution is 8.1, then the value of p is
3
6
4
5
20.
For the following frequency distribution
| Class | Frequency |
| 0-5 | 2 |
| 5-10 | 7 |
| 10-15 | 18 |
| 15-20 | 10 |
| 20-25 | 8 |
| 25-30 | 5 |
If the mode and the median are 12.9 and 14.44 respectively, then the mean is
15.2
16
13
17
21.
If the point of intersection of a less than and more than ogive is (15,20), then the value of median is
5
20
15
35
22.
The median of the given data is 46 and the total number of items is 230
| variable | Frequency | Cumulative Frequency |
| 10-20 | 12 | 12 |
| 20-30 | 30 | 42 |
| 30-40 | 34 | 76 |
| 40-50 | 65 | 141 |
| 50-60 | 46 | 187 |
| 60-70 | 25 | 212 |
| 70-80 | 18 | 230 |
Using the formula Mode = 3 Median – 2 Mean, the mean will be
45.9
44.5
44
43
23.
If the mean and the median are 25.41 and 26.5 respectively. then the mode is
29
28.68
25.6
28
24.
Calculate mode of the following data: 20,60,70,70,60,70,60,10,70,80
70
20
80
60
25.
If the mean of the following data is 18.75, then the value of p is
| x1 | 10 | 15 | p | 25 | 30 |
| f1 | 5 | 10 | 7 | 8 | 2 |
18.5
20
15
30
26.
The mean of 5 observations x, x + 2, x + 4, x + 6 and x + 8 is 11, then the value of x is:
6
11
4
7
27.
If there are two class intervals 10-20 and 20-30, then in which interval will 20 fall?
10-20
20-30
Neither in 10-20 nor 20-30
In both, 10-20 and 20-30
28.
For the following distribution the modal class is
| Marks below | 10 | 20 | 30 | 40 | 50 | 60 |
| Number of students | 2 | 11 | 25 | 45 | 57 | 75 |
20-30
40-50
30-40
10-20
29.
Frequency table of the marks of 50 students as given below:
| Marks Obtained | 0-10 | 10-20 | 20-30 | 30-40 | 40-50 | 50-60 |
| No of students | 3 | f1 | 20 | 10 | 5 | f2 |
Given that the median marks are 28.5, the missing frequencies will be
f1 = 7, f2 = 9
f1 = 5, f2 = 7
f1 = 8, f2 = 7
f1= 7, f2 = 5
30.
The value of the observation having greatest frequency is called____
Mean
Median
Mode
All of above
31.
Median of the data represented below is

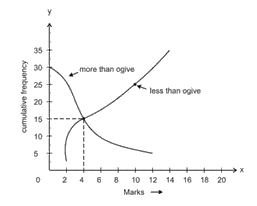
3
Less than 4
4
Between 2-4
32.
A boy scored the following marks in various tests during a term, each test being marked out of 20 15, 17, 16, 7, 10, 12, 14, 16, 19, 12, 16. The median marks are
15
16
13
18
33.
The relation connecting the measures of central tendencies is
Mode = 2 median + 3 mean
Mode = 3 median – 2 mean
Mode = 3 median + 2 mean
Mode = 2 median – 3 mean
34.
A batsman in his 12th innings makes a score of 63 runs and thereby increases his average score by 2. His average score after 12th
41
60
51
45
35.
If the median of the following data is 166.79, then the mean and mode are
| Class Interval | Frequency |
| 130-140 | 5 |
| 140-150 | 9 |
| 150-160 | 17 |
| 160-170 | 28 |
| 170-180 | 24 |
| 180-190 | 10 |
| 190-200 | 7 |
Mode = 161.9 Mean = 168
Mode = 152.9 Mean = 166.73
Mode = 160.9 Mean = 167
Mode = 167.3, Mean = 168.03
36.
The COVID-19 pandemic, also known as the coronavirus pandemic, is an ongoing pandemic of coronavirus disease 2019 (COVID-19) caused by severe acute respiratory syndrome coronavirus 2 (SARS-CoV-2). It was first identified in December 2019 in Wuhan, China.
During survey, the ages of 80 patients infected by COVID and admitted in the one of the City hospital were recorded and the collected data is represented in the less than cumulative frequency distribution table
| Age(in year) | Below 15 | Below 25 | Below 35 | Below 45 | Below 55 | Below 65 |
| No. of patients | 6 | 17 | 38 | 61 | 75 | 8 |
Based on the above information, answer the following questions
(a) The modal class interval is :
| (i) 45-55 | (ii) 35-45 | (iii) 25-35 | (iv) 15-25 |
(b) The median class interval is
| (i) 45-55 | (ii) 35-45 | (iii) 25-35 | (iv) 15-25 |
(c) The modal age of the patients admitted in the hospital is :
| (i) 38.6 years | (ii) 35.8 years | (iii) 36.8 years | (iv) 38.5 years |
(d) Which age group was affected the most?
| (i) 35-45 | (ii) 25-35 | (iii) 15-25 | (iv) 45-55 |
(e) How many patients of the age 45 years and above were admitted?
| (i) 61 | (ii) 19 | (iii) 14 | (iv) 23 |
37.
A group of students decided to make a project on Statistics. They are collecting the heights (in cm) of their 51 girls of Class X-A, B and C of their school. After collecting the data, they arranged the data in the following less than cumulative frequency distribution table form:
| Height (in cm) | Number of girls |
| Less than 140 | 4 |
| Less than 145 | 11 |
| Less than 150 | 29 |
| Less than 155 | 40 |
| Less than 160 | 46 |
| Class intervals | Frequency | Cumulative frequency |
| Below 140 | 4 | 4 |
| 140 - 145 | 7 | 11 |
| 145 - 150 | 18 | 29 |
| 150 - 155 | 11 | 40 |
| 155 - 160 | 6 | 46 |
| 160 - 165 | 5 | 51 |
(i) What is the lower limit of median class?
| (a) 145 | (b) 150 | (c) 155 | (d) 160 |
(ii) What is the upper limit of modal class?
| (a) 145 | (b) 150 | (c) 155 | (d) 160 |
(iii) What is the mean of lower limits of median and modal class?
| (a) 145 | (b) 150 | (c) 155 | (d) 160 |
(iv) What is the width of the class?
| (a) 10 | (b) 15 | (c) 5 | (d) none of these |
(v) The median is :
| (a) 149.03 cm | (b) 146.03 cm | (c) 147.03 cm | (d) 148.03 cm |
38.
An agency has decided to install customised playground equipments at various colony parks. For that they decided to study the age-group of children playing in a park of the particular colony. The classification of children according to their ages, playing in a park is shown in the following table
| Age group of children (in years) | 6-8 | 8-10 | 10-12 | 12-14 | 14-16 |
| Number of children | 43 | 58 | 70 | 42 | 27 |
Based on the above information, answer the following questions.
(i) The maximum number of children are of the age-group
| (a) 12-14 | (b) 10-12 | (c) 14-16 | (d) 8-10 |
(ii) The lower limit of the modal class is
| (a) 10 | (b) 12 | (c) 14 | (d) 8 |
(iii) Frequency of the class succeeding the modal class is
| (a) 58 | (b) 70 | (c) 42 | (d) 27 |
(iv) The mode of the ages of children playing in the park is
| (a) 9 years | (b) 8 years | (c) 11.5 years | (d) 10.6 years |
(v) If mean and mode of the ages of children playing in the park are same, then median will be equal to
| (a) Mean | (b) Mode |
| (c) Both (a) and (b) | (d) Neither (a) nor (b) |
1.
Given, radius of cone (r) = 7 cm
and height of cone (h) = 2r = 14 cm
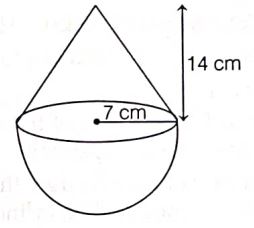
\(\therefore\) Volume of the solid = Volume of cone + Volume of hemisphere
\(=\frac{1}{3} \pi r^2 h+\frac{2}{3} \pi r^3\)
\(=\frac{1}{3} \times \frac{22}{7} \times 7^2 \times 14+\frac{2}{3} \times \frac{22}{7} \times(7)^3\)
\(=\frac{1}{3} \times \frac{22}{7} \times 7^3(2+2)=\frac{22}{3} \times 7^2 \times 4\)
\(=\frac{4312}{3} \mathrm{~cm}^3\)
2.
Let us make the following table for the given data.
| Class interval | Number of students (fi) | Class mark (xi) | fixi |
| 10-25 | 2 | \(\frac{10+25}{2}\)=17.5 | 35.0 |
| 25-40 | 3 | \(\frac{25+40}{2}\)=32.5 | 97.5 |
| 40-55 | 7 | \(\frac{40+45}{2}\)=47.5 | 332.5 |
| 55-70 | 6 | \(\frac{55+70}{2}\)=62.5 | 375.0 |
| 70-85 | 6 | \(\frac{70+85}{2}\)=77.5 | 465.0 |
| 85-100 | 6 | \(\frac{85+100}{2}\)=92.5 | 555.0 |
| Total | \(\Sigma {f}_{i}=30\) | \(\Sigma {f}_{i}{x}_{i}=1860.5\) |
\(\text { Here, } \Sigma f_{i}=30 \text { and } \Sigma f_{i} x_{i}=1860.0\)
On putting the values of \( \Sigma f_{i} x_{i}\) and \( \Sigma f_{i}\) in the formula
\(\bar{x}=\frac{\Sigma f_{i} x_{i}}{\Sigma f_{i}}\) we get
\(\bar {x} =\frac{1860.0}{30}=62\)
Hence, the mean marks obtained by the students are 62.
3.
| Class Interval | Frequency |
| 0-10 | 8 |
| 10-20 | 12 |
| 20-30 | 25 |
| 30-40 | 13 |
| 40-50 | 12 |
| Total | 70 |
Here Modal Class = 20-30
i=20,f1=25,,f2=13 , f0=12 , h=10
\(=l+\left( \frac { f_{ 1 }-f_{ 0 } }{ 2f_{ 1 }-f_{ 0 }-f_{ 2 } } \right) \times h\)
\(20+\frac { 25-12 }{ 50-12-13 } \times 10\)
=20+5.2=25.2
4.
| C.I | f | c.f |
| 0-10 | 5 | 5 |
| 10-20 | x | x+5 |
| 20-30 | 20 | x+25 |
| 30-40 | 15 | x+40 |
| 40-50 | y | x+y+40 |
| 50-60 | 5 | x+y+45 |
| \(\Sigma f=60\) |
x+y=60-45=15
Median = 28.5
Median class = 20 - 30
Median = l + \(\frac { \frac { N }{ 2 } c.f }{ f } \times h\)
\(28.5=20+\frac { \left\lfloor 30-(x+5) \right\rfloor }{ 20 } \times 10\)
\(8.5=\frac { 25-x }{ 2 } \)
25-x=17 x=25-17=8
y=15-8=7
5.
| Height | Frequency | c.f. |
| 100-120 | 12 | 12 |
| 120-140 | 14 | 26 |
| 140-160 | 8 | 34 |
| 160-180 | 6 | 40 |
| 180-200 | 10 | 50 |
| Total | 50 |
\(N=50\Rightarrow \frac { N }{ 2 } =\frac { 50 }{ 2 } =25\)
So ,Median class =120-140
Median = l + \(l+\left( \frac { \frac { N }{ 2 } -c.f }{ f } \right) \times h\)
= \(120+\frac { 260 }{ 14 } \)
= 120+18.57
Median = 138.57
6.
Given, median=137 units and mean=137.05 units
We know that,
Mode=3(Median-2(Mean)
=3(137)-2(137.05)
=411-274.10=136.90
Hence, the value of mode is 136.90 units.
7.
(i) The cumulative frequency table of given frequency distribution is
| Monthly consumption (in units) | Number of consumers (fi) | Cumulative frequency (cf) |
| 65-85 | 4 | 4 |
| 85-105 | 5 | 9 |
| 105-125 | 13 | 22 = cf |
| 125-145 | 20 = f | 42 |
| 145-165 | 14 | 56 |
| 165-185 | 8 | 64 |
| 185-205 | 4 | 68 |
| Total | n = 68 |
Here, n = 68
\(\therefore \quad \frac{n}{2}=34\)
Since, the cumulative frequency just greater than 34 is 42 and the corresponding class is 125- 145. So, the median class is 125-145.
Now, l = 125, f = 20, cf = 22 and h = 20
\(\begin{aligned} & \therefore \text { Median }=l+\left\{\frac{\frac{n}{2}-c f}{f}\right\} \times h \\ \end{aligned}\)
\(\begin{aligned} \quad=125+\left\{\frac{34-22}{20}\right\} \times 20=125+12=137 \text { units } \end{aligned}\)
(ii) Let the assumed mean, a = 135
and width of the class, h = 20
Table for the given data is
| Monthly consumption (in units) | Number of consumers (fi) | Class marks (xi) | \(u_1=\frac{x_i-135}{20}\) | fiui |
| 65-85 | 4 | 75 | -3 | -12 |
| 85-105 | 5 | 95 | -2 | -10 |
| 105-125 | 13 | 115 | -1 | -13 |
| 125-145 | 20 | a = 135 | 0 | 0 |
| 145-165 | 14 | 155 | 1 | 14 |
| 165-185 | 8 | 175 | 2 | 16 |
| 185-205 | 4 | 195 | 3 | 12 |
| Total | N = 68 | \(\sum\)fiui = 7 |
We have, N = 68, and \(\sum\)fiui = 7
By step deviation method,
Mean = \(\begin{aligned} \text { Mean } & =a+b \times \frac{1}{N} \times \Sigma f_i u_i=135+20 \times \frac{1}{68} \times 7 \\ \end{aligned}\)
\(\begin{aligned} & =135+\frac{35}{17}=135+2.05=137.05 \text { units } \end{aligned}\)
(iii) Here, the modal class is 125-145 having maximum frequency, f1 = 20.
Now, f0 = 13, f2 = 14, l = 125 and h = 20
\(\begin{aligned} \therefore \text { Mode } & =l+\left\{\frac{f_1-f_0}{2 f_1-f_0-f_2}\right\} \times h \\ \end{aligned}\)
\(\begin{aligned} & =125+\left\{\frac{20-13}{40-13-14}\right\} \times 20 \\ \end{aligned}\)
\(\begin{aligned} & =125+\frac{7 \times 20}{13}=125+\frac{140}{13} \end{aligned}\)
= 125 + 10.77 = 135.77 units
Hence, median = 137 units, mean = 137.05 units and mode = 135.77 units
So, we conclude that three measures are approximately the same.
(iv) Electricity consumption can be reduced by
(a) switching off electric appliances when not in use.
(b) using star rated AC's, refrigerators.
8.
| Height (in cm | Frequency | Cumulative Frequency |
| 150 - 155 155 - 160 160 - 165 165 - 170 170 - 175 175 - 180 |
12 b 10 d e 2 |
a 25 c 43 48 f |
| Total | 50 |
Here, a= 12, Now 12 + b = 25
\(\Rightarrow\) b = 13
25 + 10 = c
\(\Rightarrow\) c = 35
c + d = 43
\(\Rightarrow\) 35 + d = 43 \(\Rightarrow\) d = 8
43 + e = = 48 \(\Rightarrow\) e = 5, 48 + 2 = f
\(\Rightarrow\) f = 50
\(\therefore\) a = 12, b = 13, c = 35,
d = 8, e = 5, f = 50
So given distribution becomes
| Height (in cm) | Frequency |
|---|---|
| 150 - 1-55 155 - 160 160 - 165 165 - 170 170 - 175 175 - 180 |
12 13 10 8 5 2 |
Modal class is 155 - 160
l = 155,f0 = 12,f1 = 13,f2 = 10,h = 5
Mode = l + \(\left( { {{f}_{1}-{f}_{0} }\over{ 2{f}_{1}-{f}_{0}-{f}_{2}} } \right)\times h\)
= 155 + \({ { 13-12 }\over{ 2\times13-12-10} }\times5\)
= 155 + \({ { 5 }\over{ 4 } }\) = 155 + 1.2 = 156.23
9.
(i) 45.8 kg
(ii) The values like humanity, social service and honesty in performing duty are depicted here.
10.
The cumulative frequencies with their respective class intervals are as follows.
| Life time | Number of lamps (fi) | Cumulative frequency |
| 1500 − 2000 | 14 | 14 |
| 2000 − 2500 | 56 | 14 + 56 = 70 |
| 2500 − 3000 | 60 | 70 + 60 = 130 |
| 3000 − 3500 | 86 | 130 + 86 = 216 |
| 3500 − 4000 | 74 | 216 + 74 = 290 |
| 4000 − 4500 | 62 | 290 + 62 = 352 |
| 4500 − 5000 | 48 | 352 + 48 = 400 |
| Total (n) | 400 |
It can be observed that the cumulative frequency just greater than n/2 (i.e 400/2 = 200) is 216
belonging to class interval 3000 − 3500.
Median class = 3000 − 3500
Lower limit (l) of median class = 3000
Frequency (f) of median class = 86
Cumulative frequency (cf) of class preceding median class = 130
Class size (h) = 500
\(\text { Median }=l+\left(\frac{\frac{n}{2}-c f}{f}\right) \times h \)
\(=3000+\left(\frac{200-130}{86}\right) \times 500 \)
\(=3000+\frac{70 \times 500}{86}\)
= 3406.976
Therefore, median life time of lamps is 3406.98 hours.
11.
Modal class = 35-40
l=35, f1=50 , f2=42 , f0=34 , h=5
Mode = l+ \(\frac { (f_{ 1 }-f_{ 0 }) }{ 2f_{ 1 }-f_{ 0 }-f_{ 2 } } \times h\)
\(=35+\frac { 50-34 }{ 100-34-42 } \times 5\)
\(=35+\frac { 16\times 5 }{ 24 } =38.33\)
12.
| Class Interval | cf | f |
| 0-10 | 63 | 5 |
| 10-20 | 58 | 3 |
| 20-30 | 55 | 4 |
| 30-40 | 51 | 3 |
| 40-50 | 48 | 6 |
| 50-60 | 42 | 42 |
So, frequency of the class 30 - 40 is 3.
Class mark of the class: 10-25 = \(\frac { 10+25 }{ 2 } \)
\(=\frac { 35 }{ 2 } =17.5\)
13.
45
14.
\(\because \quad \overline { x } =\frac { \sum { f_{ i }x_{ i } } }{ n } \Rightarrow \sum { f_{ i }x_{ i } } =n\overline { x }\)
\( \\ \therefore \quad \sum { \left( f_{ i }x_{ i }-\overline { x } \right) } =\sum { f_{ i }x_{ i } } -\sum { \overline { x } }\)
\( \\ =n\overline { x } -n\overline { x }\)
\( \\ =0\)
15.
Given, \( \sum { f_{ i }u_{ i }=30 } \), \(\sum { f_{ i }=40 } \) and \(u_{ i }=\frac { x_{ i }-20 }{ 10 } \)
We know that, \(u_{ i }=\frac { x_{ i }-a }{ h } \)
On comparing, we get a=20, h=10
\(\therefore \quad \overline { x } =a+\left\{ \frac { \sum { f_{ i }u_{ i } } }{ \sum { f_{ i } } } \right\} \times h=20+\left\{ \frac { 30 }{ 40 } \right\} \times 10\\ =20+\frac { 30 }{ 4 } =\frac { 80+30 }{ 4 } =\frac { 110 }{ 4 } =27.5\)
16.
(a)
15
17.
(b)
x + y = 19
18.
(b)
7
19.
(b)
6
20.
(a)
15.2
21.
(c)
15
22.
(a)
45.9
23.
(b)
28.68
24.
(a)
70
25.
(b)
20
26.
(d)
7
27.
(b)
20-30
28.
(b)
40-50
29.
(b)
f1 = 5, f2 = 7
30.
(c)
Mode
31.
(c)
4
32.
(a)
15
33.
(b)
Mode = 3 median – 2 mean
34.
(a)
41
35.
(a)
Mode = 161.9 Mean = 168
36.
| Age(in yrs) | No. of patients | cf |
| 5 – 15 | 6 | 6 |
| 15 – 25 | 11 | 17 |
| 25 – 35 | 21 | 38 |
| 35 – 45 | 23 | 61 |
| 45 – 55 | 14 | 75 |
| 55 – 65 | 5 | 80 |
(a) (ii) Since the highest frequency is 23 which belongs to 35 – 45.
Therefore, modal class is 35 – 45.
(b) (ii) Here, \(n=80 \Rightarrow \frac{n}{2}=40\)
which lies in 35 – 45
Therefore, medial class is 35 – 45.
(c) (iii) Here,l = 35, f0 = 21, f1= 23, f2 = 14, h = 10.
\(\text { Mode }=l+\frac{f_{1}-f_{0}}{2 f_{1}-f_{0}-f_{2}} \times h \quad \Rightarrow \text { Mode }=35+\frac{23-21}{46-21-14} \times 10\)
(d) (i) 35-45
(e) (ii)19
37.
(i) (a): \(n=51 . \mathrm{So}, \frac{n}{2}=\frac{51}{2}=25.5 .\)
This observation lies in the class 145 - 150
= 145
(ii) (b): 150
(iii) (a): 145
(iv) (c): 5
(v) (a): l ( lower limit) = 145, cf = 11, f = 18, h = 5.
\(\text { Median }=l+\left(\frac{\frac{n}{2}-\mathrm{cf}}{f}\right) \times h\)
\(\text { Median }=145+\left(\frac{25.5-11}{18}\right) \times 5=145+\frac{72.5}{18}\)
= 149.03 cm
38.
(i) (b): Since, the highest frequency is 70, therefore the maximum number of children are of the age-group 10-12.
(ii) (a): Since, the modal class is 10-12
\(\therefore\) Lower limit of modal class = 10
(iii) (c) : Here,f0 = 58,f1 = 70 and f2 = 42
Thus, the frequency of the class succeeding the modal class is 42.
(iv) (d): Mode \(=l+\left[\frac{f_{1}-f_{0}}{2 f_{1}-f_{0}-f_{2}}\right] \times h\)
\(=10+\left[\frac{70-58}{140-58-42}\right] \times 2\)
\(=10+\frac{12}{40} \times 2=10+\frac{24}{40}=10.6 \text { years }\)
(v) (c): Given that, Mean = Mode
\(\therefore\) By Empirical relation, we have
Mode = 3 Median - 2 Mean
\(\Rightarrow\) Mode = 3 Median - 2 Mode
\(\Rightarrow\) 3 Mode = 3 Median
\(\Rightarrow\) Median = Mode = Mean

10th Standard CBSE Syllabus & Materials
10th Standard CBSE
CBSE 10th Social Science PS - Federalism - New Model Questions Papers Study Material - QB365 Set A
NEW10th Standard CBSE
CBSE 10th Social Science PS - Power Sharing - New Model Questions Papers Study Material - QB365 Set A
NEW10th Standard CBSE
CBSE 10th Social Science GEO - Manufacturing Industries - New Model Questions Papers Study Material - QB365 Set A
NEW10th Standard CBSE
CBSE 10th Social Science GEO - Minerals and Energy Resources - New Model Questions Papers Study Material - QB365 Set A



NCERT Books

Syllabus

Exam Pattern

Sample Question Papers

Previous year Question Papers

Important Notes

MCQ Practice test

NCERT Exemplers

Case study Questions

Image Based Questions

Passage based Questions

HOT Questions

Value Based Questions

Model Questions Papers
NCERT ( Book Back ) Questions

Assertion and Reason
Important Questions And Answers

CBSE 10th Standard CBSE Subjects
CBSE Standards