
 100% FREE ACCESS
10th Standard CBSE Syllabus & Materials
10th Standard CBSE
CBSE 10th Social Science ECO - Globalisation and the Indian Economy - New Model Questions Papers Study Material - QB365 Set A
NEW10th Standard CBSE
CBSE 10th Social Science ECO - Money and Credit - New Model Questions Papers Study Material - QB365 Set A
NEW10th Standard CBSE
CBSE 10th Social Science ECO - Sectors of the Indian Economy - New Model Questions Papers Study Material - QB365 Set A
NEW10th Standard CBSE
CBSE 10th Social Science ECO - Development - New Model Questions Papers Study Material - QB365 Set A
NEW10th Standard CBSE
CBSE 10th Social Science PS - Outcomes of Democracy - New Model Questions Papers Study Material - QB365 Set A
NEW10th Standard CBSE
CBSE 10th Social Science PS - Gender, Religion and Caste - New Model Questions Papers Study Material - QB365 Set A

Published on: 20/10/2025
Download CBSE Class 10th Standard CBSE Maths question papers, sample papers, important questions, and previous year solved papers in PDF format. Get free study materials, NCERT solutions, and exam preparation resources for Class 10th Standard CBSE Maths
Questions + Answers key
Take MCQ Maths Test
1.
Find the mean of the following data, by using step deviation method.
| Class | 10-20 | 20-30 | 30-40 | 40-50 | 50-60 | 60-70 |
|---|---|---|---|---|---|---|
| Frequency | 4 | 28 | 15 | 20 | 17 | 16 |
2.
The lengths of 40 leaves of a plant are measured correct to the nearest millimetre, and the data obtained is represented in the following table :
| Length (in mm) | Number of leaves |
|---|---|
| 118-126 | 3 |
| 127-135 | 5 |
| 136-144 | 9 |
| 145-153 | 12 |
| 154-162 | 5 |
| 163-171 | 4 |
| 172-180 | 2 |
Find the median length of the leaves.
3.
If the median of the distribution given below is 28.5, find the values of x and y.
| Class interval | Frequency |
|---|---|
| 0-10 | 5 |
| 10-20 | x |
| 20-30 | 20 |
| 30-40 | 15 |
| 40-50 | y |
| 50-60 | 5 |
| Total | 60 |
4.
The sum of the lower limit of the median class and the upper limit of the modal class
| Class | 10-20 | 20-30 | 30-40 | 40-50 | 50-60 | 60-70 |
|---|---|---|---|---|---|---|
| Frequency | 1 | 3 | 5 | 9 | 7 | 3 |
5.
The regarding marks obtained by 48 students of a class in a class test is given below. Calculate the modal marks of students.
| Marks Obtained | 0-5 | 5-10 | 10-15 | 15-20 | 20-25 | 25-30 | 30-35 | 35-40 | 40-45 | 45-50 |
|---|---|---|---|---|---|---|---|---|---|---|
| Number of students | 1 | 0 | 2 | 0 | 0 | 10 | 25 | 7 | 2 | 1 |
6.
Find p, the mean of the given data is 15.45.
| Class interval | 0-6 | 6-12 | 12-18 | 18-24 | 24-30 |
|---|---|---|---|---|---|
| Frequency | 6 | 8 | p | 9 | 7 |
7.
Calculate mode of the following data.
| Marks obtained | 0-20 | 20-40 | 40-60 | 60-80 | 80-100 |
|---|---|---|---|---|---|
| Number of students | 8 | 10 | 12 | 6 | 3 |
8.
If the mean of the following distribution is 6, find the value of a.
| xi | 2 | 4 | 6 | 10 | a+5 |
|---|---|---|---|---|---|
| fi | 3 | 2 | 3 | 1 | 2 |
9.
If \(u_{ i }=\frac { x_{ i }-20 }{ 10 } ,\quad \sum { f_{ i }u_{ i }=30 } \) and \(\sum { f_{ i }=40 } \) , find the value of \(\overline { x } \) .
10.
If the mean and median of a data are 10 and 11 respectively, then mode of the data is
12
8
20
13
11.
If the mean of the following data is 18.75, then the value of p is
| x1 | 10 | 15 | p | 25 | 30 |
| f1 | 5 | 10 | 7 | 8 | 2 |
18.5
20
15
30
12.
If there are two class intervals 10-20 and 20-30, then in which interval will 20 fall?
10-20
20-30
Neither in 10-20 nor 20-30
In both, 10-20 and 20-30
13.
For a symmetrical distribution, which is correct
Mean = Median = Mode
Mean < Mode < Median
Mean > Mode > Median
Mode = Mean + Median/2
14.
The relation connecting the measures of central tendencies is
Mode = 2 median + 3 mean
Mode = 3 median – 2 mean
Mode = 3 median + 2 mean
Mode = 2 median – 3 mean
15.
For the following distribution the differences in the upper limit of median and modal class is
| C1 | 0-10 | 10-20 | 20-30 | 30-40 | 40-50 |
| F | 2 | 5 | 7 | 5 | 2 |
40
10
0
20
16.
| Expendicture | 0-10 | 10-20 | 20-30 | 30-40 | 40-50 |
| No. of families | 14 | 23 | 27 | 21 | 15 |
What is the mode of the given data?
25
27
22
21
17.
The median of first ten natural numbers is
6
5.5
11
5
18.
The mean of the following data is: 45, 35, 20, 15, 25, 40
15
25
35
30
19.
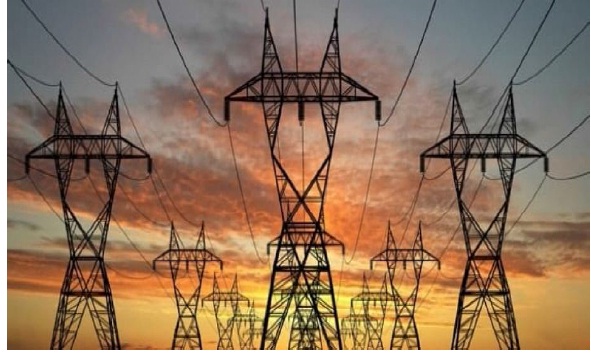
A group of students went to another city to collect the data of monthly consumptions (in units) to complete their Statistics project. They prepare the following frequency distribution table from the collected data gives the monthly consumers of a locality.
| Monthly consumption (in units) | No.of consumers |
| 65 - 85 | 4 |
| 85 - 105 | 5 |
| 105 - 125 | 13 |
| 125 - 145 | 20 |
| 145 - 165 | 14 |
| 165 - 185 | 8 |
| 185 - 205 | 4 |
(i) What is the lower limit of median class?
| (a) 125 | (b) 145 | (c) 165 | (d) 185 |
(ii) What is the lower limit of modal class?
| (a) 125 | (b) 145 | (c) 165 | (d) 185 |
(iii) What is the mean of upper limits of median and modal class?
| (a) 125 | (b) 145 | (c) 165 | (d) 185 |
(iv) What is the width of the class?
| (a) 10 | (b) 15 | (c) 20 | (d) 25 |
(v) The median is :
| (a) 137 | (b) 135 | (c) 125 | (d) 135.7 |
20.
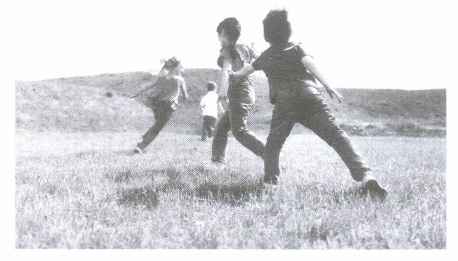
An agency has decided to install customised playground equipments at various colony parks. For that they decided to study the age-group of children playing in a park of the particular colony. The classification of children according to their ages, playing in a park is shown in the following table
| Age group of children (in years) | 6-8 | 8-10 | 10-12 | 12-14 | 14-16 |
| Number of children | 43 | 58 | 70 | 42 | 27 |
Based on the above information, answer the following questions.
(i) The maximum number of children are of the age-group
| (a) 12-14 | (b) 10-12 | (c) 14-16 | (d) 8-10 |
(ii) The lower limit of the modal class is
| (a) 10 | (b) 12 | (c) 14 | (d) 8 |
(iii) Frequency of the class succeeding the modal class is
| (a) 58 | (b) 70 | (c) 42 | (d) 27 |
(iv) The mode of the ages of children playing in the park is
| (a) 9 years | (b) 8 years | (c) 11.5 years | (d) 10.6 years |
(v) If mean and mode of the ages of children playing in the park are same, then median will be equal to
| (a) Mean | (b) Mode |
| (c) Both (a) and (b) | (d) Neither (a) nor (b) |
1.
Here, class width, h = 20 - 10- = 10. Nw, let the assumed
Mean, a = 35.
Then, table for the given data is
| Class | xi | fi | \(u_{ i }=\frac { x_{ i }-a }{ h } \) | fiui |
|---|---|---|---|---|
| 10-20 | \(\frac { 10+20 }{ 2 } =15\) | 4 | \(\frac { 15-35 }{ 10 } =\frac { -20 }{ 10 } =-2\) | -8 |
| 20-30 | \(\frac { 20+30 }{ 2 } =25\) | 28 | \(\frac { 25-35 }{ 10 } =\frac { -10 }{ 10 } =-1\) | -28 |
| 30-40 | \(\frac { 30+40 }{ 2 } =35=a\) | 15 | \(\frac { 35-35 }{ 10 } =\frac { 0 }{ 10 } =0\) | 0 |
| 40-50 | \(\frac { 40+50 }{ 2 } =45\) | 20 | \(\frac { 45-35 }{ 10 } =\frac { 10 }{ 10 } =1\) | 20 |
| 50-60 | \(\frac { 50+60 }{ 2 } =55\) | 17 | \(\frac { 55-35 }{ 10 } =\frac { 20 }{ 10 } =2\) | 34 |
| 60-70 | \(\frac { 60+70 }{ 2 } =65\) | 16 | \(\frac { 65-35 }{ 10 } =\frac { 30 }{ 10 } =3\) | 48 |
| Total | \(\sum { f_{ i } } =100\) | \(\sum { f_{ i }u_{ i } } =66\) |
Now, we have,
\(\sum { f_{ i }u_{ i } } =66\), \(\sum { f_{ i } } =100\), a=35 and h=10
Mean \((\overline { x } )=a+\left( \frac { \sum { f_{ i }u_{ i } } }{ \sum { f_{ i } } } \right) \times h\)
\(=35+\frac { 66 }{ 100 } \times 10\)
\(=35+\frac { 66 }{ 100 } \)
\(=35+6.6=41.6\)
2.
Here, the given data is not in continuous classes, so we convert it intocontinuous classes for finding, the median. For this, change the classes to 117.5-126.5, 126.5-135.5, ..., 171.5-180.5 i.e., subtract 0.5 from lower limit of each class interval and add 0.5 to upper limit of each class interval.
Then, cumulative frequency table for given distribution is
| Lengths (in mm) | Number of leaves (fi) | Cumulative frequency (cf) |
| 117.5-126.5 | 3 | 3 = 3 |
| 126.5-135.5 | 5 | 3 + 5 = 8 |
| 135.5-144.5 | 9 | 8 + 9 = 17 |
| 144.5-153.5 | 12 | 17 + 12 = 29 |
| 153.5-162.5 | 5 | 29 + 5 = 34 |
| 162.5-171.5 | 4 | 34 + 4 = 38 |
| 171.5-180.5 | 2 | 38 + 2 = 40 |
| Total | n = 40 |
Here, \(n=40 \Rightarrow \frac{n}{2}=\frac{40}{2}=20\)
the cumulative frequency just greater than 20 is 29 and the corresponding class is 144.5-153.5. thus, we have the median class 144.5-153.5.
The cumulative frequency just greater than 20 is 29 and the corresponding class is 144.5-153.5. thus, we have the median class 144.5-153.5.
Now, l = 144.5, f = 12, cf = 17, h = 9.
\(\begin{aligned} \therefore \text { Median } & =l+\left\{\frac{\frac{n}{2}-c f}{f}\right\} \times h=144.5+\left\{\frac{20-17}{12}\right\} \times 9 \\ \end{aligned}\)
\(\begin{aligned} =144.5+\frac{9}{4}=144.5+2.25=146.75 \mathrm{~mm} \end{aligned}\)
3.
The cumulative frequency for the given data is calculated as follows
| Class interval | Frequency | Cumulative frequency |
| 0 - 10 | 5 | 5 |
| 10 - 20 | x | 5+ x |
| 20 - 30 | 20 | 25 + x |
| 30 - 40 | 15 | 40 + x |
| 40 - 50 | y | 40+ x + y |
| 50 - 60 | 5 | 45 + x + y |
| Total (n) | 60 |
From the table, it can be observed that n = 60
45 + x + y = 60
x + y = 15 (1)
Median of the data is given as 28.5 which lies in interval 20 - 30.
Therefore, median class = 20 - 30
Lower limit (l) of median class = 20
Cumulative frequency (cf) of class preceding the median class = 5 + x
Frequency (f) of median class = 20
Class size (h) = 10
\(\text { Median }=l+\left(\frac{\left(\frac{n}{2}\right)-c f}{f}\right) \times h\)
28.5 = 20 + [(60/2-(5+x))/20]xx10
8.5 = ((25-x)/2)
17 = 25 - x
8 + y = 15
y = 7
Hence, the values of x and y are 8 and 7 respectively.
4.
| Class | 10-20 | 20-30 | 30-40 | 40-50 | 50-60 | 60-70 |
|---|---|---|---|---|---|---|
| Frequency | 1 | 3 | 5 | 9 | 7 | 3 |
| Cumulative Frequency | 1 | 4 | 9 | 18 | 25 | 28 |
Median class : 40 - 50 \(\Rightarrow \) Lower Limit =40
Modal class : 40 - 50 \(\Rightarrow \) Upper Limit = 50
Their sum = 40+50=90
5.
Modal class is 30 - 35, f = 30,f1 = 25, f0 = 10,f2 = 7, h =5
Mode = l+ \(\left( \frac { f_{ 1 }-f_{ 0 } }{ 2f_{ 1 }-f_{ 0 }-f_{ 2 } } \right) \times h\Rightarrow \)Mode = 30+ \(\frac { 25-10 }{ 50-10-7 } \times 5\)
= 30+2.27 or 32.27 approx.
6.
10
7.
45
8.
Table for given distribution is
| xi | fi | fixi |
|---|---|---|
| 2 | 3 | 6 |
| 4 | 2 | 8 |
| 6 | 3 | 18 |
| 10 | 1 | 10 |
| a+5 | 2 | 2a+10 |
| Total | \(\sum { f_{ i }=11 } \) | \(\sum { f_{ i }x_{ i }=2a+52 } \) |
Here, n=\(\sum { f_{ i }=11 } \), \(\sum { f_{ i }x_{ i }=2a+52 } \)
Mean\(=\frac { \sum { f_{ i }x_{ i } } }{ \sum { f_{ i } } } \)
\(\Rightarrow \quad \frac { 2a+52 }{ 11 } =6\)
\(\\ \Rightarrow \quad 2a+52=66\Rightarrow 2a=66-52=14\)
\(\\ a=\frac { 14 }{ 2 } =7\)
9.
Given, \( \sum { f_{ i }u_{ i }=30 } \), \(\sum { f_{ i }=40 } \) and \(u_{ i }=\frac { x_{ i }-20 }{ 10 } \)
We know that, \(u_{ i }=\frac { x_{ i }-a }{ h } \)
On comparing, we get a=20, h=10
\(\therefore \quad \overline { x } =a+\left\{ \frac { \sum { f_{ i }u_{ i } } }{ \sum { f_{ i } } } \right\} \times h=20+\left\{ \frac { 30 }{ 40 } \right\} \times 10\\ =20+\frac { 30 }{ 4 } =\frac { 80+30 }{ 4 } =\frac { 110 }{ 4 } =27.5\)
10.
(d)
13
11.
(b)
20
12.
(b)
20-30
13.
(a)
Mean = Median = Mode
14.
(b)
Mode = 3 median – 2 mean
15.
(c)
0
16.
(b)
27
17.
(b)
5.5
18.
(d)
30
19.
(i) (a):
| Monthly consumption (in units) | No.of consumers (fi) | cumulative frequency |
| 65 - 85 | 4 | 4 |
| 85 - 105 | 5 | 9 |
| 105 - 125 | 13 | 22 |
| 125 - 145 | 20 | 42 |
| 145 - 165 | 14 | 56 |
| 165 - 185 | 8 | 64 |
| 185 - 205 | 4 | 68 |
| Total | \(\Sigma f_{i}=n=68\) |
Here, \(\Sigma f_{i}=n=68 \text { then } \frac{n}{2}=\frac{68}{2}=34\) which lies in interval 125 - 145
= 125
(ii) (a): 125
(iii) (b): 145
(iv) (c): 20
(v) (a): Median class = 125 - 145
So, l = 125; n = 68; f = 20; cf = 22 and h = 20
Using formula, Median \(=l+\left[\frac{\frac{n}{2}-c f}{f}\right] \times h\)
\(=125+\left\{\frac{\frac{68}{2}-22}{20}\right\} \times 20\)
\(=125+\frac{34-22}{20} \times 20=125+12\)
= 137
20.
(i) (b): Since, the highest frequency is 70, therefore the maximum number of children are of the age-group 10-12.
(ii) (a): Since, the modal class is 10-12
\(\therefore\) Lower limit of modal class = 10
(iii) (c) : Here,f0 = 58,f1 = 70 and f2 = 42
Thus, the frequency of the class succeeding the modal class is 42.
(iv) (d): Mode \(=l+\left[\frac{f_{1}-f_{0}}{2 f_{1}-f_{0}-f_{2}}\right] \times h\)
\(=10+\left[\frac{70-58}{140-58-42}\right] \times 2\)
\(=10+\frac{12}{40} \times 2=10+\frac{24}{40}=10.6 \text { years }\)
(v) (c): Given that, Mean = Mode
\(\therefore\) By Empirical relation, we have
Mode = 3 Median - 2 Mean
\(\Rightarrow\) Mode = 3 Median - 2 Mode
\(\Rightarrow\) 3 Mode = 3 Median
\(\Rightarrow\) Median = Mode = Mean

10th Standard CBSE Syllabus & Materials
10th Standard CBSE
CBSE 10th Social Science PS - Federalism - New Model Questions Papers Study Material - QB365 Set A
NEW10th Standard CBSE
CBSE 10th Social Science PS - Power Sharing - New Model Questions Papers Study Material - QB365 Set A
NEW10th Standard CBSE
CBSE 10th Social Science GEO - Manufacturing Industries - New Model Questions Papers Study Material - QB365 Set A
NEW10th Standard CBSE
CBSE 10th Social Science GEO - Minerals and Energy Resources - New Model Questions Papers Study Material - QB365 Set A



NCERT Books

Syllabus

Exam Pattern

Sample Question Papers

Previous year Question Papers

Important Notes

MCQ Practice test

NCERT Exemplers

Case study Questions

Image Based Questions

Passage based Questions

HOT Questions

Value Based Questions

Model Questions Papers
NCERT ( Book Back ) Questions

Assertion and Reason
Important Questions And Answers

CBSE 10th Standard CBSE Subjects
CBSE Standards