
 100% FREE ACCESS
10th Standard CBSE Syllabus & Materials
10th Standard CBSE
CBSE 10th Social Science ECO - Globalisation and the Indian Economy - New Model Questions Papers Study Material - QB365 Set A
NEW10th Standard CBSE
CBSE 10th Social Science ECO - Money and Credit - New Model Questions Papers Study Material - QB365 Set A
NEW10th Standard CBSE
CBSE 10th Social Science ECO - Sectors of the Indian Economy - New Model Questions Papers Study Material - QB365 Set A
NEW10th Standard CBSE
CBSE 10th Social Science ECO - Development - New Model Questions Papers Study Material - QB365 Set A
NEW10th Standard CBSE
CBSE 10th Social Science PS - Outcomes of Democracy - New Model Questions Papers Study Material - QB365 Set A
NEW10th Standard CBSE
CBSE 10th Social Science PS - Gender, Religion and Caste - New Model Questions Papers Study Material - QB365 Set A

Published on: 20/10/2025
Download CBSE Class 10th Standard CBSE Maths question papers, sample papers, important questions, and previous year solved papers in PDF format. Get free study materials, NCERT solutions, and exam preparation resources for Class 10th Standard CBSE Maths
Questions + Answers key
Take MCQ Maths Test
1.
Vocational training complements traditional education by providing practical skills and hands on experience. While education equips individuals with a broad knowledge base, vocational training focuses on job-specific skills, enhancing employability thus making the student self-reliant. Keeping this in view, a teacher made the following table giving the frequency distribution of students/adults undergoing vocational training from the training institute.

| Age (in years) | 15-19 | 20-24 | 25-29 | 30-34 | 35-39 | 40-44 | 45-49 | 50-54 |
| Number of participants | 62 | 132 | 96 | 37 | 13 | 11 | 10 | 4 |
From the above, answer the following questions.
(a) What is the lower limit of the modal class of the above data?
(b) (i) Find the median class of the above data.
Or
(ii) Find the number of participants of age less than 50 yr who undergo vocational training.
(c) Give the empirical relationship between mean, median and mode.
2.
Electricity energy consumption is the form of energy consumption that uses electric energy. Global electricity consumption continues to increase faster than world population, leading to an increase in the average amount of electricity consumed per person (per capita electricity consumption).
| Tariff : LT-Residential | Bill Number : 384756 |
| Type of supply : Single Phase | Connected Load : 3kW |
| Meter Reading Date: 31-11-13 | Meter Reading : 65789 |
| Previous Reading date : 31-10-13 | Previous Meter Reading : 65500 |
| Units Consumed : 289 |
A survey is conducted for 56 families of a Colony A. The following tables gives the weekly consumption of electricity of these families.
| Weekly consumption (in units) | 0-10 | 10-20 | 20-30 | 30-40 | 40-50 | 50-60 |
| number of families | 16 | 12 | 18 | 6 | 4 | 0 |
The similar survey is conducted for 80 families of colony B and the data is recorded as below:
| Weekly consumption (in units) | 0-10 | 10-20 | 20-30 | 30-40 | 40-50 | 50-60 |
| Number of families | 0 | 5 | 10 | 20 | 40 | 5 |
Refer to data received from Colony A
(i) The median weekly consumption is
(a) 12 units (b) 16 units (c) 20 units (d) None of these
(ii) The mean weekly consumption is
(a) 19.64 units (b) 22.5 units (c) 26 units (d) None of these
(iii) The modal class of the above data is
(a) 0-10 (b) 10-20 (c) 20-30 (d) 30-40
Refer to data received from Colony B
(iv) The modal weekly consumption is
(a) 38.2 units
(b) 43.6 units
(c) 26 units
(d) 32 units
(v) The mean weekly consumption is
(a) 15.65 units (b) 32.8 units (c) 38.75 units (d) 48 units
3.
The COVID-19 pandemic also known as coronavirus pandemic, is an ongoing pandemicof coronavirus disease caused by the transmission of severe acute respiratory syndrome corona virus 2 (SARS-CoV-2) among humans.
The following tables shows the age distribution of case admitted during a day in two different hospitals
Table 1
| Age (in years) | 5-15 | 15-25 | 25-35 | 35-45 | 45-55 | 55-65 |
| Number of cases | 6 | 11 | 21 | 23 | 14 | 5 |
Table 2
| Age (in years) | 5-15 | 15-25 | 25-35 | 35-45 | 45-55 | 55-65 |
| Number of cases | 8 | 16 | 10 | 42 | 24 | 12 |
Refer to Table 1
(i) The average age for which maximum cases occurred is
(a) 32.24 (b) 34.36 (c) 36.82 (d) 42.24
(ii) The upper limit of modal class is
(a) 15 (b) 25 (c) 35 (d) 45
(iii) The mean of the given data is
(a) 26.2 (b) 32.4 (c) 33.5 (d) 35.4
Refer to Table 2
(iv) The mode of the given data is
(a) 41.4 (b) 48.2 (c) 55.3 (d) 64.6
(v) the median of the given data is
(a) 32.7 (b) 40.2 (c) 42.3 (d) 48.6
4.
100m RACE
A stopwatch was used to find the time that it took a group of students to run 100 m.
| Time in (sec) | 0-20 | 20-40 | 40-60 | 60-80 | 80-100 |
| No.of students | 8 | 10 | 13 | 6 | 3 |
(i) Estimate the mean time taken by a student to finish the race.
| (a) 54 | (b) 63 | (c) 43 | (d) 50 |
(ii) What will be the upper limit of the modal class ?
| (a) 20 | (b) 40 | (c) 60 | (d) 80 |
(iii) The construction of cumulative frequency table is useful in determining the
| (a) Mean | (b) Median | (c) Mode | (d) All of the above |
(iv) The sum of lower limits of median class and modal class is
| (a) 60 | (b) 100 | (c) 80 | (d) 140 |
(v) How many students finished the race within 1 minute?
| (a) 18 | (b) 37 | (c) 31 | (d) 8 |
5.
A group of students went to another city to collect the data of monthly consumptions (in units) to complete their Statistics project. They prepare the following frequency distribution table from the collected data gives the monthly consumers of a locality.
| Monthly consumption (in units) | No.of consumers |
| 65 - 85 | 4 |
| 85 - 105 | 5 |
| 105 - 125 | 13 |
| 125 - 145 | 20 |
| 145 - 165 | 14 |
| 165 - 185 | 8 |
| 185 - 205 | 4 |
(i) What is the lower limit of median class?
| (a) 125 | (b) 145 | (c) 165 | (d) 185 |
(ii) What is the lower limit of modal class?
| (a) 125 | (b) 145 | (c) 165 | (d) 185 |
(iii) What is the mean of upper limits of median and modal class?
| (a) 125 | (b) 145 | (c) 165 | (d) 185 |
(iv) What is the width of the class?
| (a) 10 | (b) 15 | (c) 20 | (d) 25 |
(v) The median is :
| (a) 137 | (b) 135 | (c) 125 | (d) 135.7 |
6.
A group of students decided to make a project on Statistics. They are collecting the heights (in cm) of their 51 girls of Class X-A, B and C of their school. After collecting the data, they arranged the data in the following less than cumulative frequency distribution table form:
| Height (in cm) | Number of girls |
| Less than 140 | 4 |
| Less than 145 | 11 |
| Less than 150 | 29 |
| Less than 155 | 40 |
| Less than 160 | 46 |
| Class intervals | Frequency | Cumulative frequency |
| Below 140 | 4 | 4 |
| 140 - 145 | 7 | 11 |
| 145 - 150 | 18 | 29 |
| 150 - 155 | 11 | 40 |
| 155 - 160 | 6 | 46 |
| 160 - 165 | 5 | 51 |
(i) What is the lower limit of median class?
| (a) 145 | (b) 150 | (c) 155 | (d) 160 |
(ii) What is the upper limit of modal class?
| (a) 145 | (b) 150 | (c) 155 | (d) 160 |
(iii) What is the mean of lower limits of median and modal class?
| (a) 145 | (b) 150 | (c) 155 | (d) 160 |
(iv) What is the width of the class?
| (a) 10 | (b) 15 | (c) 5 | (d) none of these |
(v) The median is :
| (a) 149.03 cm | (b) 146.03 cm | (c) 147.03 cm | (d) 148.03 cm |
7.
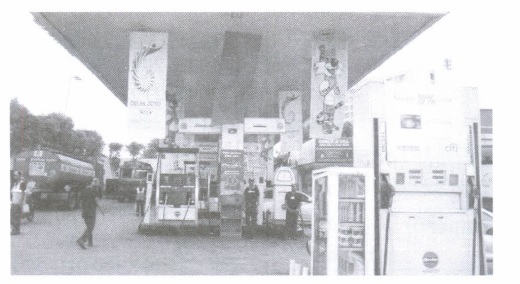
A petrol pump owner wants to analyse the daily need of diesel at the pump. For this he collected the data of vehicles visited in 1 hr. The following frequency distribution table shows the classification of the number of vehicles and quantity of diesel filled in them.
| Diesel Filled (in Litres) | 3-5 | 5-7 | 7-9 | 9-11 | 11-13 |
| Number of vehicles | 5 | 10 | 10 | 7 | 8 |
Based on the above data, answer the following questions.
(i) Which of the following is correct?
| (a) If xi and fi are sufficiently small, then direct method is appropriate choice for calculating mean. |
| (b) If xi and fi are sufficiently large, then direct method is appropriate choice for calculating mean. |
| (c) If xi and fi are sufficiently small, then assumed mean method is appropriate choice for calculating mean. |
| (d) None of the above. |
(ii) Average diesel required for a vehicle is
| (a) 8.15 litres | (b) 6 litres | (c) 7 litres | (d) 5.5 litres |
(iii) If approximately 2000 vehicles comes daily at the petrol pump, then how much litres of diesel the pump should have?
| (a) 16200 litres | (b) 16300 litres | (c) 10600 litres | (d) 15000 litres |
(iv) The sum of upper and lower limit of median class is
| (a) 22 | (b) 10 | (c) 16 | (d) none of these |
(v) If the median of given data is 8litres, then mode will be equal to
| (a) 7.5 litres | (b) 7.7 litres | (c) 5.7 litres | (d) 8 litres |
8.
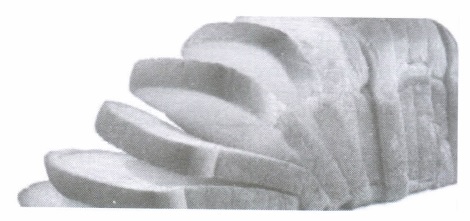
A bread manufacturer wants to know the lifetime of the product. For this, he tested the life time of 400 packets of bread. The following tables gives the distribution of the life time of 400 packets.
| Lifetime (in hours) | Number of packets (Cumulative frequency) |
| 150-200 | 14 |
| 200-250 | 70 |
| 250-300 | 130 |
| 300-350 | 216 |
| 350-400 | 290 |
| 400-450 | 352 |
| 450-500 | 400 |
Based on the above information, answer the following questions.
(i) If m be the class mark and b be the upper limit of a class in a continuous frequency distribution, then lower limit of the class is
| (a) 2m + b | (b) 2m+\(\sqrt{b}\) | (c) m - b | (d) 2m-b |
(ii) The average lifetime of a packet is
| (a) 341 hrs | (b) 300 hrs | (c) 340 hrs | (d) 301 hrs |
(iii) The median lifetime of a packet is
| (a) 347 hrs | (b) 340 hrs | (c) 346 hrs | (d) 342 hrs |
(iv) If empirical formula is used, then modal lifetime of a packet is
| (a) 340 hrs | (b) 341 hrs | (c) 348 hrs | (d) 349 hrs |
(v) Manufacturer should claim that the lifetime of a packet is
| (a) 346 hrs | (b) 341 hrs | (c) 340 hrs | (d) 347hrs |
9.
Household income in India was drastically impacted due to the COVID-19 loekdown. Most of the companies decided to bring down the salaries of the employees by 50%.
The following table shows the salaries (in percent) received by 25 employees during loekdown.
| Salaries received (in percent) | 50-60 | 60-70 | 70-80 | 80-90 |
| Number of employees | 9 | 6 | 8 | 2 |
Based on the above information, answer the following questions.
(i) Total number of persons whose salary is reduced by more than 30%, is
| (a) 10 | (b) 20 | (c) 25 | (d) 15 |
(ii) Total number of persons whose salary is reduced by atmost 40%, is
| (a) 15 | (b) 10 | (c) 16 | (d) 8 |
(iii) The modal class is
| (a) 50-60 | (b) 60-70 | (c) 70-80 | (d) 80-90 |
(iv) The median class of the given data is
| (a) 50-60 | (b) 60-70 | (c) 70-80 | (d) 80-90 |
(v) The empirical relationship between mean, median and mode is
| (a) 3 Median = Mode + 2 Mean | (b) 3 Median = Mode - 2 Mean |
| (c) Median = 3 Mode - 2 Mean | (d) Median = 3 Mode + 2 Mean |
10.
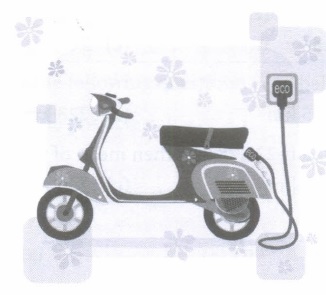
An electric scooter manufacturing company wants to declare the mileage of their electric scooters. For this, they recorded the mileage (km/ charge) of 50 scooters of the same model. Details of which are given in the following table.
| Mileage (km/charge) | 100-120 | 120-140 | 140-160 | 160-180 |
| Number of scooters | 7 | 12 | 18 | 13 |
Based on the above information, answer the following questions.
(i) The average mileage is
| (a) 140 krn/charge | (b) 150 krn/ charge | (c) 130 krn/charge | (d) 144.8 krn/charge |
(ii) The modal value of the given data is
| (a) 150 | (b) 150.91 | (c) 145.6 | (d) 140.9 |
(ill) The median value of the given data is
| (a) 140 | (b) 146.67 | (c) 130 | (d) 136.6 |
(iv) Assumed mean method is useful in determining the
| (a) Mean | (b) Median | (c) Mode | (d) All of these |
(v) The manufacturer can claim that the mileage for his scooter is
| (a) 144 krn/charge | (b) 155 krn/charge | (c) 165 krn/charge | (d) 175krn/charge |
11.
A group of 71 people visited to a museum on a certain day. The following table shows their ages.
| Age (in years) | Number of persons |
| Less than 10 | 3 |
| Less than 20 | 10 |
| Less than 30 | 22 |
| Less than 40 | 40 |
| Less than 50 | 54 |
| Less than 60 | 71 |
Based on the aboxe information, answer the following questions.
(i) If true class limits have been decided by making the classes of interval 10, then first class must be
| (a) 5-15 | (b) 0-10 |
| (c) 10-20 | (d) none of these |
(ii) The median class for the given data will be
| (a) 20-30 | (b) 10-20 | (c) 30-40 | (d) 40-50 |
(iii) The cumulative frequency of class preceding the median class is
| (a) 22 | (b) 13 | (c) 25 | (d) 35 |
(iv) The median age of the persons visited the museum is
| (a) 30 years | (b) 32.5 years | (c) 34 years | (d) 37.5 years |
(v) If the price of a ticket for the age group 30-40 is Rs 30, then the total amount spent by this age group is
| (a) Rs 360 | (b) Rs 420 | (c) Rs 540 | (d) Rs 340 |
12.
Transport department of a city wants to buy some Electric buses for the city. For which they wants to analyse the distance travelled by existing public transport buses in a day.
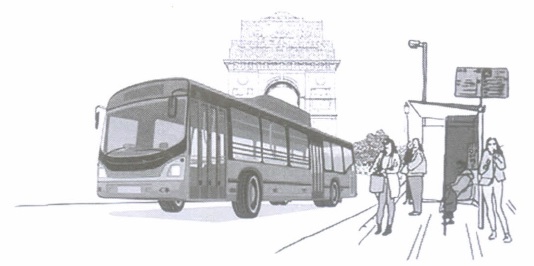
The following data shows the distance travelled by 60 existing public transport buses in a day.
| Daily distance travelled (in km) | 200-209 | 210-219 | 220-229 | 230-239 | 240-249 |
| Number of buses | 4 | 14 | 26 | 10 | 6 |
Based on the above information, answer the following questions.
(i) The upper limit of a class and lower limit of its succeeding class is differ by
| (a) 9 | (b) 1 | (c) 10 | (d) none of these |
(ii) The median class is
| (a) 229.5-239.5 | (b) 230-239 | (c) 220-229 | (d) 219.5-229.5 |
(iii) The cumulative frequency of the class preceding the median class is
| (a) 14 | (b) 18 | (c) 26 | (d) 10 |
(iv) The median of the distance travelled is
| (a) 222 km | (b) 225 km | (c) 223 km | (d) none of these |
(v) If the mode of the distance travelled is 223.78 km, then mean of the distance travelled by the bus is
| (a) 225 km | (b) 220 km | (c) 230.29 km | (d) 224.29 km |
13.
On a particular day, National Highway Authority ofIndia (NHAI) checked the toll tax collection of a particular toll plaza in Rajasthan.
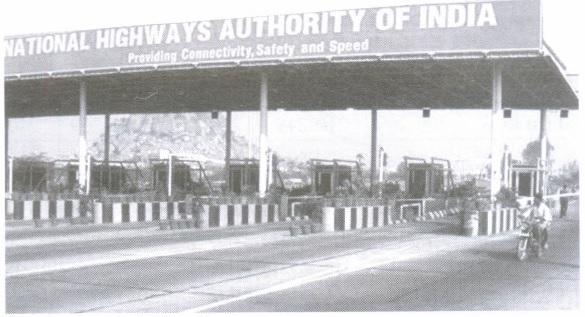
The following table shows the toll tax paid by drivers and the number of vehicles on that particular day.
| Toll tax (in Rs) | 30-40 | 40-50 | 50-60 | 60-70 | 70-80 |
| Number of vehicles | 80 | 110 | 120 | 70 | 40 |
Based on the above information, answer the following questions.
(i) If A is taken as assumed mean, then the possible value of A is
| (a) 32 | (b) 42 | (c) 85 | (d) 55 |
(ii) If xi's denotes the class marks and fi's denotes the deviation of assumed mean (A) from xi's, then the minimum value of |di| is
| (a) -200 | (b) -100 | (c) 0 | (d) 100 |
(iii) The mean of toll tax received. by NHAI by assumed mean method is
| (a) Rs 52 | (b) Rs 52.14 | (c) Rs 52.50 | (d) Rs 53.50 |
(iv) The mean of toll tax received by NHAI by direct method is
| (a) equal to the mean of toll tax received by NHAI by assumed mean method |
| (b) greater than the mean of toll tax received by NHAI by assumed mean method |
| (c) less than the mean of toll tax received by NHAI by assumed mean method |
| (d) none of these |
(v) The average toll tax received by NHAI in a day, from that particular toll plaza, is
| (a) Rs 21000 | (b) Rs 21900 | (c) Rs 30000 | (d) none of these |
14.
As the demand for the products grew, a manufacturing company decided to hire more employees. For which they want to know the mean time required to complete the work for a worker. The following table shows the frequency distribution of the time required for each worker to complete a work.
| Time (in hours) | 15-19 | 20-24 | 25-29 | 30-34 | 35-39 |
| Number of workers | 10 | 15 | 12 | 8 | 5 |
Based on the above information, answer the following questions.
(i) The class mark of the class 25-29 is
| (a) 17 | (b) 22 | (c) 27 | (d) 32 |
(ii) If xi's denotes the class marks and fi's denotes the corresponding frequencies for the given data, then the value of \(\sum x_{i} f_{i}\) equals to
| (a) 1200 | (b) 1205 | (c) 1260 | (d) 1265 |
(iii) The mean time required to complete the work for a worker is
| (a) 22 hrs | (b) 23 hrs | (c) 24 hrs | (d) none of these |
(iv) If a worker works for 8 hrs in a day, then approximate time required to complete the work for a worker is
| (a) 3 days | (b) 4 days | (c) 5 days | (d) 6 days |
(v) The measure of central tendency is
| (a) Mean | (b) Median | (c) Mode | (d) All of these |
15.
An agency has decided to install customised playground equipments at various colony parks. For that they decided to study the age-group of children playing in a park of the particular colony. The classification of children according to their ages, playing in a park is shown in the following table
| Age group of children (in years) | 6-8 | 8-10 | 10-12 | 12-14 | 14-16 |
| Number of children | 43 | 58 | 70 | 42 | 27 |
Based on the above information, answer the following questions.
(i) The maximum number of children are of the age-group
| (a) 12-14 | (b) 10-12 | (c) 14-16 | (d) 8-10 |
(ii) The lower limit of the modal class is
| (a) 10 | (b) 12 | (c) 14 | (d) 8 |
(iii) Frequency of the class succeeding the modal class is
| (a) 58 | (b) 70 | (c) 42 | (d) 27 |
(iv) The mode of the ages of children playing in the park is
| (a) 9 years | (b) 8 years | (c) 11.5 years | (d) 10.6 years |
(v) If mean and mode of the ages of children playing in the park are same, then median will be equal to
| (a) Mean | (b) Mode |
| (c) Both (a) and (b) | (d) Neither (a) nor (b) |
1.
(a) Modal class is the class interval in a frequency distribution table which has the highest frequency. According to the given data, the highest frequency is 132 and the class interval corresponding to it is 20-24.
Thus, the modal class of the above data is 20-24.
Hence, lower limit of the modal class is 20.
(b) (i) Convert the given data as continuous classes and calculate the cumulative frequency.
| Class interval (Age) | Frequency (f) | Comulative frequency (cf) |
| 14.5 - 19.5 | 62 | 62 |
| 19.5 - 24.5 | 132 | 194 |
| 24.5 - 29.5 | 96 | 290 |
| 29.5 - 34.5 | 37 | 327 |
| 34.5 - 39.5 | 13 | 340 |
| 39.5 - 44.5 | 11 | 351 |
| 44.5 - 49.5 | 10 | 361 |
| 49.5 - 54.5 | 4 | 365 |
Here, N = 365 (odd)
\(\frac{N}{2}=\frac{365}{2}=182.5\)
Cumulative frequency greater than and nearer to 182.5 is 194 which belongs to the class interval 19.5-24.5
\(\therefore\) The median class of the above data is 19.5 - 24.5.
(ii) Number of participants of age less than 50 yr who undergo vocational training
= 62 + 132 + 96 + 37 + 13 + 11 + 10 = 361
Therefore, required number of participants is 361.
(c) The empirical relationship between mean, median and mode is given by
Mode = 3 Median - 2 Mean
2.
(i) (c)
| Weekly consumption | Number of families (f1) | Cumulative frequency (cf) |
| 0-10 | 16 | 16 |
| 10-20 | 12 | 28 |
| 20-30 | 18 | 46 |
| 30-40 | 6 | 52 |
| 40-50 | 4 | 56 |
| 50-60 | 0 | 56 |
| Total | N = 56 |
Here, N = 56
\(\therefore \quad \frac{N}{2}=\frac{56}{2}=28\)
\(\because\) Median class = 20-30
\(\therefore\) l = 20, cf = 28, h = 10 and f = 18
Now, median weekly consumption
\(=l+\frac{\left(\frac{N}{2}-c f\right)}{f} \times h=20+\left(\frac{28-28}{18}\right) \times 10\)
= 20 + 0 = 20 units
(ii) (a)
| Class | xi | fi | fixi |
| 0-10 | 5 | 16 | 80 |
| 10-20 | 15 | 12 | 180 |
| 20-30 | 25 | 18 | 450 |
| 30-40 | 35 | 6 | 210 |
| 40-50 | 45 | 4 | 180 |
| 50-60 | 55 | 0 | 0 |
| Total | \(\Sigma f=56\) | \(\Sigma f x=1100\) |
\(\therefore \text { Mean }=\frac{\Sigma f_i x_i}{\Sigma f_i}=\frac{1100}{56}=19.64 \text { units }\)
(iii) (c) Here, maximum frequency is 18 and the class corresponding to this frequency is 20-30.
So, modal class is 20-30.
(iv) (b) Here maximum frequency is 40 and class corresponding to this frequency is 40-50.
So, modal class is 40-50.
| Weekly consumption (in units) | 0-10 | 10-20 | 20-30 | 30-40 | 40-50 | 50-60 |
| Number of families | 0 | 5 | 10 | 20 | 40=f1 | 5 |
\(\therefore\) l = 40, f1 = 40, f0 = 20, f2 = 5 and h= 10
Now, modal weekly consumption
\(\begin{aligned} & =l+\left(\frac{f_1-f_0}{2 f_1-f_0-f_2}\right) \times h \\ \end{aligned}\)
\(\begin{aligned} & =40+\left(\frac{40-20}{80-20-5}\right) \times 10 \\ \end{aligned}\)
\(\begin{aligned} & =40+\frac{20}{55} \times 10 \end{aligned}\)
= 40 + 3.6
= 43.6 units
(v) (c)
| Class | xi | fi | fixi |
| 0-10 | 5 | 0 | 0 |
| 10-20 | 15 | 5 | 75 |
| 20-30 | 25 | 10 | 250 |
| 30-40 | 35 | 20 | 700 |
| 40-50 | 45 | 40 | 1800 |
| 50-60 | 55 | 5 | 275 |
| \(\Sigma f_i=80 \) | \(\Sigma f_i x_i=3100\) |
\(\therefore \text { Mean consumption }=\frac{3100}{80}=38.75 \text { units }\)
3.
(i) (c) From table, we see that maximum frequency is 23.Therefore, modal class is 35-45.
Here, l=35, f1 = 23, f0 = 21, f2 = 14 and h = 10
\(\begin{aligned} \therefore \text { Mode } & =l+\frac{f_1-f_0}{2 f_1-f_0-f_2} \times h \\ \end{aligned}\)
\(\begin{aligned} & =35+\frac{23-21}{46-21-14} \times 10 \\ \end{aligned}\)
\(\begin{aligned} & =35+\frac{20}{11}=35+1.82=36.82 \end{aligned}\)
(ii) (d) Since, class interval 35-45 has highest frequency i.e. 23, So it is modal class.
\(\therefore\) Upper limit of modal class is 45.
(iii) (d) Calculation of mean
| Class interval | Frequency (f1) | Class marks (xi) | fixi |
| 5-15 | 6 | 10 | 60 |
| 15-25 | 11 | 20 | 220 |
| 25-35 | 21 | 30 | 630 |
| 35-45 | 23 | 40 | 920 |
| 45-55 | 14 | 50 | 700 |
| 55-65 | 5 | 60 | 300 |
| Total | \(\Sigma\)fi = 80 | \(\Sigma f_i x_i=2830\) |
\(\therefore\) \(\text { Mean, } \bar{x}=\frac{\Sigma f_i x_i}{\Sigma f_i}=\frac{2830}{80}=35.375=35.4\)
(iv) (a) Here, maximum frequency is 42 and the class corresponding to this frequency is 35 – 45. So, the modal class is 35-45.
\(\therefore\) l = 35, f1 = 42, f0 = 10, f2 = 24 and h = 10
Now, mode = \(\begin{aligned} & =l+\left(\frac{f_1-f_0}{2 f_1-f_0-f_2}\right) \times h \\ \end{aligned}\)
\(\begin{aligned} & =35+\frac{42-10}{2 \times 42-10-24} \times 10 \\ \end{aligned}\)
\(\begin{aligned} & =35+\frac{32}{50} \times 10=35+6.4=41.4 \end{aligned}\)
(v) (b) The cumulative frequency table for given data is
| Age | Number of cases (fi) | Cumulative frequency (cf) |
| 5-15 | 8 | 8 |
| 15-25 | 16 | 24 |
| 25-35 | 10 | 34 |
| 35-45 | 42 | 76 |
| 45-55 | 24 | 100 |
| 55-65 | 12 | 112 |
| Total | N = 112 |
Here, N = 112
\(\therefore \quad \frac{N}{2}=\frac{112}{2}=56\)
Since, the cumulative frequency just greater that 56 is 76 and the corresponding class interval is 35-45.
\(\therefore\) Median class = 35 - 45,
l = 35, cf = 34, h = 10 and f = 42
\(\begin{aligned} \therefore \text { Median } & =l+\frac{\left(\frac{N}{2}-f\right)}{f} \times h=35+\frac{56-34}{42} \times 10 \\ \end{aligned}\)
\(\begin{aligned} & =35+\frac{22}{42} \times 10=35+5.24=40.24 \end{aligned}\)
4.
(i) (c):
| Time in (sec) | x | f | cf | fx |
| 0-20 | 10 | 8 | 8 | 80 |
| 20-40 | 30 | 10 | 18 | 300 |
| 40-60 | 50 | 13 | 31 | 650 |
| 60-80 | 70 | 6 | 37 | 420 |
| 80-100 | 90 | 3 | 40 | 270 |
| Total | 40 | 1720 |
\(\text { Mean }=\frac{1720}{40}\)
= 43
(ii) (c): 60
(iii) (b): Median
(iv) (c): Median class 40 - 60, Modal class = 40 - 60
Sum of lower limits of median class and modal class = 40 + 40 = 80
(v) (c): Number of students are = 8 + 10 + 13
= 31
5.
(i) (a):
| Monthly consumption (in units) | No.of consumers (fi) | cumulative frequency |
| 65 - 85 | 4 | 4 |
| 85 - 105 | 5 | 9 |
| 105 - 125 | 13 | 22 |
| 125 - 145 | 20 | 42 |
| 145 - 165 | 14 | 56 |
| 165 - 185 | 8 | 64 |
| 185 - 205 | 4 | 68 |
| Total | \(\Sigma f_{i}=n=68\) |
Here, \(\Sigma f_{i}=n=68 \text { then } \frac{n}{2}=\frac{68}{2}=34\) which lies in interval 125 - 145
= 125
(ii) (a): 125
(iii) (b): 145
(iv) (c): 20
(v) (a): Median class = 125 - 145
So, l = 125; n = 68; f = 20; cf = 22 and h = 20
Using formula, Median \(=l+\left[\frac{\frac{n}{2}-c f}{f}\right] \times h\)
\(=125+\left\{\frac{\frac{68}{2}-22}{20}\right\} \times 20\)
\(=125+\frac{34-22}{20} \times 20=125+12\)
= 137
6.
(i) (a): \(n=51 . \mathrm{So}, \frac{n}{2}=\frac{51}{2}=25.5 .\)
This observation lies in the class 145 - 150
= 145
(ii) (b): 150
(iii) (a): 145
(iv) (c): 5
(v) (a): l ( lower limit) = 145, cf = 11, f = 18, h = 5.
\(\text { Median }=l+\left(\frac{\frac{n}{2}-\mathrm{cf}}{f}\right) \times h\)
\(\text { Median }=145+\left(\frac{25.5-11}{18}\right) \times 5=145+\frac{72.5}{18}\)
= 149.03 cm
7.
(i) (a): If fi and xi are very small, then direct method is appropriate method for calculating mean.
(ii) (a) : The frequency distribution table from the given data can be drawn as :
| Class | Class mark (xi) | Frequency fi | fi xi |
| 3-5 | 4 | 5 | 20 |
| 5-7 | 6 | 10 | 60 |
| 7-9 | 8 | 10 | 80 |
| 9-11 | 10 | 7 | 70 |
| 11-13 | 12 | 8 | 96 |
| Total | 40 | 326 |
\(\therefore \quad \text { Mean }=\frac{\Sigma f_{i} x_{i}}{\Sigma f_{i}}=\frac{326}{40}=8.15 \text { litres }\)
(iii) (b) : If 2000 vehicles comes daily and average quantity of diesel required for a vehicle is 8.15 litres, then total quantity of diesel required = 2000 x 8.15
= 16300 litres
(iv) (c) : Here \(N=40 \text { and } \frac{N}{2}=20\) c.f for the distribution are 5, 15,25,32,40
Now, c.f just greater than 20 is 25 which is corresponding to the class interval 7-9.
So median class is 7-9.
\(\therefore\) Required sum of upper limit and lower limit
= 7 + 9 = 16
(v) (b): We know, Mode = 3 Median -2 Mean
= 3(8) - 2(8.15) = 24 - 16.3 = 7.7
8.
(i) (d): We know that,
\(\text { Class mark }=\frac{\text { Lower limit }+\text { Upper limit }}{2} \)
\(\Rightarrow m=\frac{\text { Lower limit }+b}{2} \Rightarrow \text { Lower limit }=2 m-b\)
(ii) (a):
| Lifetime (in hours) | Class mark (xi) | fi | di=xi-A | fi di |
| 150 -200 | 175 | 14 | -150 | -2100 |
| 200 -250 | 225 | 56 | -100 | -5600 |
| 250 -300 | 275 | 60 | -50 | -3000 |
| 300 -350 | 325 = A | 86 | 0 | 0 |
| 350 -400 | 375 | 74 | 50 | 3700 |
| 400 -450 | 425 | 62 | 100 | 6200 |
| 450 -500 | 475 | 48 | 150 | 7200 |
| Total | 400 | 6400 |
\(\begin{aligned}
&\therefore \quad \text { Average lifetime of a packet }\\
&=A+\frac{\sum f_{i} d_{i}}{\sum f_{i}}=325+\frac{6400}{400}=341 \mathrm{hrs}
\end{aligned}\)
(iii) (b) : \(\text { Here, } N=400 \Rightarrow \frac{N}{2}=200\)
Also, cumulative frequency for the given distribution are 14, 70, 130,216,290,352,400
\(\therefore\) c.f just greater than 200 is 216, which is
corresponding to the interval 300-350.
l= 300, f=86, c.f = 130, h = 50
\(\therefore \quad \text { Median }=l+\left(\frac{\frac{N}{2}-c . f .}{f}\right) \times h=300+\left(\frac{200-130}{86}\right) \times 50\)
= 300 + 40.697 = 340.697 ""340 hrs (approx.)
(iv) (a) : We know that Mode = 3 Median - 2 Mean
= 3(340.697) -2(341)
= 1022.091 - 682 = 340.091 ""340 hrs
(v) (c): Since, minimum of mean, median and mode is approximately 340 hrs. So, manufacturer should claim that lifetime of a packet is 340 hrs.
9.
(i) (d): Required number of persons = 9 + 6 = 15
(ii) (c): Required number of persons = 6 + 8 + 2 = 16
(iii) (a) : 50-60 is the modal class as the maximum frequency is 9.
(iv) (b) : The cumulative frequency distribution table for the given data can be drawn as :
| Salaries received (in percent) | Number of employees (fi) | Cumulative frequency c.f |
| 50-60 | 9 | 9 |
| 60-70 | 6 | 9 + 6 = 15 |
| 70-80 | 8 | 15 + 8 = 23 |
| 80-90 | 2 | 23 + 2 = 25 |
| Total | \(\sum f_{i}=25\) |
\(\text { Here, } \frac{N}{2}=\frac{25}{2}=12.5\)
The cumulative frequency just greater than 12.5 lies in the interval 60-70.
Hence, the median class is 60-70.
(v) (a): We know, Mode = 3 Median - 2 Mean
\(\therefore\) 3 Median = Mode + 2 Mean.
10.
Given frequency distribution table can be drawn as:
| Class interval | Class mark | Frequency (fi) | xi fi | c.f |
| 100-120 | 110 | 7 | 770 | 7 |
| 120-140 | 130 | 12 | 1560 | 19 |
| 140-160 | 150 | 18 | 2700 | 37 |
| 160-180 | 170 | 13 | 2210 | 50 |
| Total | 50 | 7240 |
(i) (d): Clearly, average mileage
\(=\frac{7240}{50}=144.8 \mathrm{~km} / \text { charge }\)
(ii) (b) : Since, highest frequency is IS, therefore,
modal class is 140-160.
Here, l = 140,f1 = 18,f0 = 12,f2 = 13, h = 20
\(\therefore \quad \text { Mode }=140+\frac{18-12}{36-12-13} \times 20=140+\frac{6}{11} \times 20 \)
\(=140+\frac{120}{11}=140+10.91=150.91\)
(iii) (b) : Here \(\frac{N}{2}=\frac{50}{2}=25\) and the corresponding class whose cumulative frequency is just greater than
25 is 140-160.
Here, l = 140, c.f = 19, h = 20 and f= 18
\(\therefore \quad \text { Median }=l+\left(\frac{\frac{N}{2}-c . f .}{f}\right) \times h\)
\(=140+\frac{25-19}{18} \times 20=140+\frac{60}{9}=146.67\)
(iv) (a) : Assumed mean method is useful in determining the mean.
(v) (a): Since, Mean = 144.S, Mode = 150.91 and Median = 146.67 and minimum of which is 144 approx, therefore manufacturer can claim the mileage for his scooter 144 km/charge.
11.
(i) (b): The age of any person is a positive number, so the first class must be 0 - 10.
(ii) (c):
Let us consider the following table:
| Age (in years) | Class interval (xi) | Frequencies (fi) | Cumulative frequency (c.f) |
| Less than 10 | 0-10 | 3 | 3 |
| Less than 20 | 10-20 | 10-3=7 | 10 |
| Less than 30 | 20-30 | 22-10-12 | 22 |
| Less than 40 | 30-40 | 40-22-18 | 40 |
| Less than 50 | 40-50 | 54-40=14 | 54 |
| Less than 60 | 50-60 | 71-54=17 | 71 |
Here, N = 71, therefore \(\frac{N}{2}=35.5\)
Now, the class interval whose cumulative frequency is
just greater than 35.5 is 30-40.
\(\therefore\) Median class = 30-40
(iii) (a): Clearly, the cumulative frequency of the class
preceding the median class is 22.
(iv) (d): Median \(=l+\left(\frac{\frac{N}{2}-\varsigma . f .}{f}\right) \times h\)
\(=30+\left(\frac{35.5-22}{18}\right) \times 10=30+13.5 \times \frac{10}{18}=30+7.5=37.5\)
Thus, the median age of the persons visited the
museum is 37.5 years
(v) (c): Number of persons, whose age lying in 30-40 = 18
\(\therefore\) Total amount spent by people of this group
= Rs (30 x 18) = Rs 540
12.
(i) (b): The upper limit of a class and the lower class of its succeeding class differ by 1.
(ii) (d) : Here, class intervals are in inclusive form. So, we first convert them in exclusive form. The frequency distribution table in exclusive form is as follows:
| Class interval | Frequency (fi) | Cumulative frequency (c.f) |
| 199.5-209.5 | 4 | 4 |
| 209.5-219.5 | 14 | 18 |
| 219.5-229.5 | 26 | 44 |
| 229.5-239.5 | 10 | 54 |
| 239.5-249.5 | 6 | 60 |
\(\text { Here, } \Sigma f_{i} \text { i.e., } N=60 \)
\(\Rightarrow \frac{N}{2}=30\)
Now, the class interval whose cumulative frequency is
just greater than 30 is 219.5 - 229.5.
\(\therefore\) Median class is 219.5 - 229.5.
(iii) (b): Clearly, the cumulative frequency of the class preceding the median class is 18
(iv) (d): Median \(=l+\left[\frac{\frac{N}{2}-c . f .}{f}\right] \times h\)
\(=219.5+\left(\frac{30-18}{26}\right) \times 10 \)
\(=219.5+\frac{12 \times 10}{26}=219.5+4.62=224.12\)
\(\therefore\) Median of the distance travelled is 224.12 km
(v) (d): We know, Mode = 3 Median - 2 Mean
\(\therefore \quad \text { Mean }=\frac{1}{2}(3 \text { Median }-\text { Mode }) \)
\(=\frac{1}{2}(672.36-223.78)=224.29 \mathrm{~km}\)
13.
Let us consider the following table:
| Class | Class marks (xi) | di=xi-A | Frequency (fi) | fi di |
| 30-40 | 35 | -20 | 80 | -1600 |
| 40-50 | 34 | -10 | 110 | -1100 |
| 50-60 | 55 = A | 0 | 120 | 0 |
| 60-70 | 65 | 10 | 70 | 700 |
| 70-80 | 75 | 20 | 40 | 800 |
| Total | \(\Sigma f_{i}=420\) | \(\sum f_{i} d_{i}=1200\) |
(i) (d): Clearly, the possible values of assumed mean (A) are 35, 45, 55, 65, 75.
(ii) (c): The values of |di| are 0, 10,20
Thus, the minimum value of |di| is 0.
(iii) (b): Required Mean \(=A+\frac{\sum f_{i} d_{i}}{\sum f_{i}}=55-\frac{1200}{420}\)
= Rs 52.14.
(iv) (a): Mean by direct and assumed mean method are always equal.
(v) (d): Average toll tax received by a vehicle = Rs 52.14 Total number of vehicles = 420
\(\therefore\) Average toll tax received in a day = Rs (52.14 x 420) = Rs 21898.80
14.
(i) (c): Class mark of class 25 - 29
\(=\frac{25+29}{2}=\frac{54}{2}=27\)
(ii) (d): Let us consider the following table:
| Class | Class mark (xi) | Frequency (fi) | = xi fi |
| 15-19 | 17 | 10 | 170 |
| 20-24 | 22 | 15 | 330 |
| 25-29 | 27 | 12 | 324 |
| 30-34 | 32 | 8 | 256 |
| 34-39 | 37 | 5 | 185 |
| Total | \(\Sigma f_{i}=50\) | \(\sum x_{i} f_{i}=1265\) |
\(\therefore \quad \operatorname{Mean}(\bar{x})=\frac{\sum x_{i} f_{i}}{\sum f_{i}}=\frac{1265}{50}=25.3\)
Thus, the mean time to complete the work for a worker
= 25.3 hrs = 3 days
(iii) (d)
(iv) (a)
(v) (d): We know the measure of central tendency are mean, median and mode.
15.
(i) (b): Since, the highest frequency is 70, therefore the maximum number of children are of the age-group 10-12.
(ii) (a): Since, the modal class is 10-12
\(\therefore\) Lower limit of modal class = 10
(iii) (c) : Here,f0 = 58,f1 = 70 and f2 = 42
Thus, the frequency of the class succeeding the modal class is 42.
(iv) (d): Mode \(=l+\left[\frac{f_{1}-f_{0}}{2 f_{1}-f_{0}-f_{2}}\right] \times h\)
\(=10+\left[\frac{70-58}{140-58-42}\right] \times 2\)
\(=10+\frac{12}{40} \times 2=10+\frac{24}{40}=10.6 \text { years }\)
(v) (c): Given that, Mean = Mode
\(\therefore\) By Empirical relation, we have
Mode = 3 Median - 2 Mean
\(\Rightarrow\) Mode = 3 Median - 2 Mode
\(\Rightarrow\) 3 Mode = 3 Median
\(\Rightarrow\) Median = Mode = Mean

10th Standard CBSE Syllabus & Materials
10th Standard CBSE
CBSE 10th Social Science PS - Federalism - New Model Questions Papers Study Material - QB365 Set A
NEW10th Standard CBSE
CBSE 10th Social Science PS - Power Sharing - New Model Questions Papers Study Material - QB365 Set A
NEW10th Standard CBSE
CBSE 10th Social Science GEO - Manufacturing Industries - New Model Questions Papers Study Material - QB365 Set A
NEW10th Standard CBSE
CBSE 10th Social Science GEO - Minerals and Energy Resources - New Model Questions Papers Study Material - QB365 Set A



NCERT Books

Syllabus

Exam Pattern

Sample Question Papers

Previous year Question Papers

Important Notes

MCQ Practice test

NCERT Exemplers

Case study Questions

Image Based Questions

Passage based Questions

HOT Questions

Value Based Questions

Model Questions Papers
NCERT ( Book Back ) Questions

Assertion and Reason
Important Questions And Answers

CBSE 10th Standard CBSE Subjects
CBSE Standards