 100% FREE ACCESS
11th Standard CBSE Syllabus & Materials
11th Standard CBSE
CBSE 11th Economics PART-A - Presentation of Data - New Sample Question Papers Study Material - QB365 Set A
NEW11th Standard CBSE
CBSE 11th Economics PART-A - Organisation of Data - New Sample Question Papers Study Material - QB365 Set A
NEW11th Standard CBSE
CBSE 11th Economics PART-A - Collection of Data - New Sample Question Papers Study Material - QB365 Set A
NEW11th Standard CBSE
CBSE 11th Economics PART-A - Introduction to Economics and Statistics - New Sample Question Papers Study Material - QB365 Set A
NEW11th Standard CBSE
CBSE 11th Business Studies International Trade Sample Question Papers Study Material - QB365 Set A
NEW11th Standard CBSE
CBSE 11th Business Studies Evolution and Fundamentals of Business Sample Question Papers Study Material - QB365 Set A

Published on: 21/10/2025
Download CBSE Class 11th Standard CBSE undefined question papers, sample papers, important questions, and previous year solved papers in PDF format. Get free study materials, NCERT solutions, and exam preparation resources for Class 11th Standard CBSE undefined
Questions + Answers key
Take MCQ Biology Test
1.
Which values are of utmost importance in making of a project?
2.
The yield of wheat and rice per acre for4 10 districts of a state is as under:
| District | 1 | 2 | 3 | 4 | 5 | 6 | 7 | 8 | 9 | 10 |
| Wheat | 12 | 10 | 15 | 19 | 21 | 16 | 18 | 9 | 25 | 10 |
| Rice | 22 | 29 | 12 | 23 | 18 | 15 | 12 | 34 | 18 | 12 |
Calculate for each crop
(i) Range
(ii) Q.D.
(iii) Mean deviation about mean
(iv) Mean deviation about median
(v) Standard deviation
(vi) Which crop has greater variation?
(vii) Compare the values of different measures for each crop.
3.
Explain the need of weights in index numbers. Explain commonly used weighting schemes.
4.
Explain merits and demerits of graphic presentation.
5.
Discuss the importance of Statistics in Economics.
6.
Discuss the central problems of an economy
7.
'Limitation of study' mentions:
Sample Size
Assumptions
Methodological limitations
All of the above
8.
For open -end classification, which of the following is the best measure of central tendency
Arithmetic mean
Geometric mean
Median
Mode
9.
The number of observations falling within a class is called:
Density
Frequency
Both (a) and (b)
None of these
10.
Who is known as father of economics?
Marshall
Adam Smith
J B Say
Robbins
11.
Elasticity of supply is measured by dividing the percentage change in quantity supplied of a good by ____________
percentage change in income
percentage change in quantity demanded of good
percentage change in price
percentage change in taste and preference
12.
Assume that when price is Rs 20, the quantity demanded is 15 units and when price is ns, the quantity demanded is 16 units. Based on this information what is the marginal revenue resulting from an increase in output from 15 units to 16 units?
Rs 18
Rs 16
Rs 12
Rs 28
13.
Which one of the following statements is correct?
When the marginal cost is rising, the average cost must also be rising.
When the average cost is rising, the marginal cost must be falling.
When the average cost is rising, the marginal cost is above the average cost.
When the average cost is falling, the marginal cost must be rising.
14.
In case of Giffen goods, the demand curve will be:
horizontal.
downward-sloping to the right.
vertical.
upward-sloping to the right.
15.
Production Possibilities Curve is also known as
Demand curve
Supply curve
Indifference curve
Transformation curve
16.
Explain the effects on the market equillibrium by imposing ban on the sale of GUTKHA in Delhi
17.
What are the two methods for determination of producer's equilibrium?
18.
Mr.Y works on some confidential data of ABC Ltd. One day, he got a call from some outsider to share one of the data he was working on. Mr.Y denied the same and did not disclose the information to the stranger? What value is reflected in this case?
19.
What is meant by 'market period'?
20.
Define marginal revenue.
21.
Comment on the following statement: "When average product and marginal product are equal, marginal product is at its maximum."
22.
Give two examples of variable costs.
23.
Suppose the price elasticity of demand for a good is -0.2. How will the expenditure on the good be affected if there is a 10% increase in the price of the good?
24.
When demand curve is Rectangular hyperbola, ED > 1.
25.
When the quantity of a variable input is increased from 3 units to 4 units, the total output increases from 70 units to 85 units. The marginal product of the variable input is 15 units.
26.
If TU remains the same; MU may be negative or positive
27.
A consumer consumes only two goods X and Y and is in equilibrium. Price of X falls. Explain the reaction of the consumer through the Utility Analysis.
28.
Calculate missing frequency if mean is known to be 26 from the data given below using direct method
| Marks | 0-10 | 10-20 | 20-30 | 30-40 | 40-50 | 50-60 |
| No of students | 8 | 12 | 20 | 10 | 6 | 4 |
29.
What are the essentials of a good statistical table?
30.
Calculate median from the following data set.
| Marks in Economics | 0-10 | 10-20 | 20-30 | 30-40 | 40-50 | 50-60 | 60-70 | 70-80 |
| No. of students | 5 | 15 | 18 | 12 | 20 | 15 | 7 | 3 |
31.
Selling cost is a nail in the coffin of consumer's sovereignty. How?
32.
Explain different types of two-dimensional diagrams.
33.
Complete the following table.
| Price(Rs) | 10 | 11 | 12 | 13 | 14 | 15 | 16 |
| Units sold | - | 9 | - | 7 | - | 5 | - |
| TR(Rs) | 100 | - | 96 | - | 84 | - | 64 |
| MR(Rs) | - | - | - | - | - | - | - |
34.
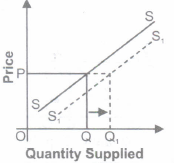
Differentiate between increase in supply ·and expansion in supply [increase in quantity supplied].
1.
(a) Originality: Project must not be copied but an original work of investigator.
(b) Sample Selection: Sample must be randomly selected. There must not be any bias in selection of the sample else the entire motto of preparing project will defeat.
(c) Decision Making: Many decisions are required to be taken in making of a project. Therefore, decision making is another important value.
(d) Communication Skills: In order to get information from people, one needs to be tactful. It calls for good communication skills.
2.
For Wheat
Range = L - S = 25 - 9 = 16
\(Q.D={Q_3-Q_2\over2}\)
First we need to arrange this data in ascending or descending order.
| 9 | 10 | 10 | 12 | 15 | 16 | 18 | 19 | 21 | 25 |
\(Q_1={N+1\over4}th \ item\)
\(={10+1\over4}th \ item\)
=2.75th item
Since 2 and 3 item are equal therefore,
Q1 =10
\(Q_3={3(N+1)\over4}th \ item\)
= 7.25th item
= 18 + (19 - 18) x 0.75 = 18.75
Q.D=\({18.75-10\over 2}=4.375\)
M.D. about Mean
| x | I X-Mean l =D | D2 |
| 9 | 6.5 | 42.25 |
| 10 | 5.5 | 30.25 |
| 10 | 5.5 | 30.25 |
| 12 | 3.5 | 12.25 |
| 15 | 0.5 | 0.25 |
| 16 | 0.5 | 0.25 |
| 18 | 2.5 | 6.25 |
| 19 | 3.5 | 12.25 |
| 21 | 5.5 | 30.25 |
| 25 | 9.5 | 90.25 |
| Total | \(\sum D=43\) | \(\sum D^2=354.5\) |
Mean=\({\sum X\over N}={155\over10}=15.5\)
\(M.D.={\sum |D|\over N}\)
M.D. = 43/10 = 4.3
Mean Deviation about Median
\(Median ={N+1\over 2}th \ item\)
\(={10+1\over 2}th \ item\)
= 5.5th item
Median = 15.5
Since Mean and Median are equal therefore, M.D. from mean and median will also be equal.
\(S.D=\sqrt{\sum D^2\over N}=\sqrt{35435\over10}\)
= 5.43 snesh
Coefficient of Variation
=\({S.D\over Mean}\times 100\)
\(={5.43\over 15.5}\times 100=29.45\%\)
For Rice
Range = L - S = 34 - 12 = 22
\(Q.D={Q_3-Q_2\over2}\)
First we need to arrange this data in ascending or descending order.
| 12 | 12 | 12 | 15 | 18 | 18 | 22 | 23 | 29 | 34 |
\(Q_1={N+1\over4}th \ item\)
\(={10+1\over4}th \ item\)
=2.75th item
Since 2 and 3 item are equal therefore ,
Q1 =12
\(Q_3={3(N+1)\over4}th \ item\)
= 7.25th item
= 22 + (23 - 22) x 0.75
= 22.75
\(Q.D.={22.75-12\over2}\)
\(={10.75\over2}=5.375\)
M.D. about Mean
| X | I X-Mean l =D | D2 |
| 12 | 7.5 | 56.25 |
| 12 | 7.5 | 56.25 |
| 12 | 7.5 | 56.25 |
| 15 | 4.5 | 20.25 |
| 18 | 1.5 | 2.25 |
| 18 | 1.5 | 2.25 |
| 22 | 2.5 | 6.25 |
| 23 | 3.5 | 12.25 |
| 29 | 9.5 | 90.25 |
| 34 | 14.5 | 210.25 |
| Total | \(\sum D=60\)\(\) | \(\)\(\sum D^2=512.5\) |
\(Mean={\sum X\over N}={195\over 10}=19.5\)
\(M.D={\sum |D|\over N}\)
M.D. = 60/10 = 6
Mean Deviation about Median
\(Median={N+1\over2}th \ item\)
\(={10+1\over2}th \ item\)
= 5.5th item
Since 5th and 6th item are equal, 5.5th item
= 18. Median is 18.
| X | IX - Median I = D |
| 12 | 6 |
| 12 | 6 |
| 12 | 6 |
| 15 | 3 |
| 18 | 0 |
| 18 | 0 |
| 22 | 4 |
| 23 | 5 |
| 29 | 11 |
| 34 | 16 |
| Total | \(\sum D=57\) |
\(M.D={\sum |D|\over N}\)
M.D. = 57/10 = 5.7
\(S.D=\sqrt{\sum D^2\over N}\)
\(=\sqrt{512.5\over10}=7.16\)
Coefficient of Variation
\(={S.D\over Mean}\times 100\)
\(={7.16\over19.5}\times 100=36.72\%\)
3.
The term weight refers to the relative importance of the different items in the construction of the index. Generally various items say wheat, rice, kerosene, clothing etc. included in the index are not of equal importance, proper weights should be attached to them to take into their relative importance. Thus there are two types of indices.
1. Unweighted indices-in which no specific weights are attached to various commodities.
2. Weighted indices-in which appropriate weights are assigned to various commodities. The Unweighted indices can be interpreted as weighted indices by assuming the corresponding weight for each commodity being unity. But actually the commodities included in the index are all not of equal importance. Therefore it is necessary to adopt some suitable method of weighting, so that arbitrary and haphazard weights may not affect the results.
There are two methods of assigning weights.
(i) Implicit weighting
(ii) Explicit weighting In implicit weighting, a commodity or its variety is included in the index a number of times. For example if wheat is to be given in an index twice as much times as rice then the-weight of wheat is two whereas in explicit weighting two types of weights can be assigned. i.e. quantity weights or value weights. A quantity weight symbolized by q means the amount of commodity produced, distributed or consumed in some time period. A value weight in the other hand combines price with quantity produced, distributed or consumed and is denoted by v = PQ. For example quantity weights are used in the method of weighted aggregative like Lasperey's, Paasche's index numbers and value weights are used in the method of weighted average of price relatives.
4.
Merits:
(a) Attractive and Impressive: Graphs are attractive and impressive.
(b) Simple and easily understandable: Graphs are easy and simple to understand. Knowledge of mathematics is not required to understand graphs.
(c) Useful in Comparison: Graphs prove very useful in comparing data from one year to another or otherwise.
(d) Helps to understand trend: Graphs help us to understand trend in a variable.
(e) Helps to measure statistical averages: Graphs are used to measure some statistical tools like median, mode, quartiles and correlation etc.
(f) Helps to understand shape of the distribution: We can use graphical presentation to understand if a curve is normal or skewed; if it is upward sloping or downward sloping etc.
(g) Helps in forecasting: It helps us to predict future values on the basis of past statistics.
(h) Graphs are useful in all fields: From sports to education to medical and engineering, in all fields we make use of graphs. They are specifically useful for policy formulation and decision making.
Disadvantages of Graphic Presentation
(a) Time Consuming: Graph making is a time consuming task.
(b) Layman Can't Understand: A layman cannot understand and interpret the data represented graphically.
(c) Not suitable for all types of data: Graphs are not suitable for all types of data.
5.
Statistics plays a very important role in the field of Economics. It is very important tool in the hands of economists. Statistics helps in Economics in many ways. Probably this is why it is a part of Economics syllabus and not any other discipline. Statistics has emerged as a lifeline of Economics. It helps an economist in following ways:
(a) It helps to Understand Economic Problems with a Quantitative Expression: No economy can solve the problem of poverty, population or unemployment without knowing their magnitude and causes. We get to know the magnitude of these problems in our economy on the basis of statistical data. Once we know the magnitude of these problems, we can think of their solutions which are called policies.
(b) Helps in Policy formulation: Policy formulation is not possible without having statical details with us. When our finance minister needs to take a decision on fund allocation to different sectors, he needs statistics; when he announces a poverty alleviation programme, he needs statistics, when he thinks of an employment policy, he needs statistics.
(c) Helps in Forecasting: In Economics, we need to forecast demand, supply, prices etc. we make use of historical data and trend analysis to make such forecasts. It is simply not possible to forecast logically without having statistical details.
(d) Helps in Formulation of theories: An Economic theory is established by developing relationship between economic variables using statistical tools. For example, Statisticians collected data on price and quantity demanded. Statisticians studied this data and found strong negative correlation between price and quantity demanded. So, law of demand was formulated. No theory or law in economics can be developed without help of statistical tools.
(e) Inter-sectoral and Inter-temporal Comparison: Statistics helps us to make inter-sectoral and intertemporal comparison. For example, to understand the problem of poverty, we wish to know the rural and urban poverty scenario. We also want to know state wise dimensions of poverty and we also compare poverty in India with other countries of the world. Similarly, we compare price rise in 2012-13 with price rise in other years. Statistics prove to be of great help in these comparisons.
(f) Developing Cause-Effect Relationship: Statistics help us to develop cause and effect relationship amongst different variables. It helps us to diagnose an economic problem. Once an economic problem is diagnosed, it can be rectified easily. What a diagnostic lab is for a doctor, so is statistics for economics.
6.
The three central problems of an economyare:
(i) What to produce?
(a) What to produce refers to a problem in which decision regarding which goods and services should be produced is to be taken.
(b) Since its resources are limited, every economy has to decide what commodities are to be produced and in what quantities.
(c) The guiding principle for an economy here is to allocate resources in such a way that gives maximum aggregate utility to the society.
(ii) How to produce?
(a) How to produce refers to a problem in which decision regarding which technique of production should be used is made.
(b) Goods and services can be produced in two ways: by using labour intensive techniques, and by using capital-intensive techniques
(c) The guiding principle for an economy in such a case has to decide about the techniques of production on the basis of cost of production. Those techniques of production should be used which lead to the least possible cost per unit of commodity or service.
(iii) For whom to produce?
(a) For whom to produce refers to a problem in which decision regarding which category of people are going to consume a good, i.e., economically poor or rich.
(b) As we know, goods and services are produced for those who can purchase them or have the capacity to buy them.
(c) Capacity to buy depends upon how income is distributed among the factors of production. The higher the income, the higher will be the capacity to buy and vice versa. So, this is a problem of distribution.
(d) The guiding principle is that the economy must see here that important and urgent wants of its citizens are being satisfied for the maximum possible extent or not.
7.
(d)
All of the above
8.
(c)
Median
9.
(b)
Frequency
10.
(b)
Adam Smith
11.
(c)
percentage change in price
12.
(c)
Rs 12
13.
(c)
When the average cost is rising, the marginal cost is above the average cost.
14.
(d)
upward-sloping to the right.
15.
(d)
Transformation curve
16.
()
Due to the ban on the sale of GUTKHA in Delhi, the supply of GUTKHA will be reduced and the firms producing GUTKHA will shift their factors of production in the production of other related goods. Consumer demand of GUTKHA will reduce and hence in this way both the demand and supply of GUTKHA will reduce.
Value: Social health conciousness
17.
()
(i) TR - TC Approach
(ii) MR - MC Approach
18.
()
The value of honesty is reflected here as Mr. Y did not disclose the information which could have been used against the interest of the company he is working for.
19.
()
Market period refers to a very short period in which no adjustment can take place in supply in response to a change in demand /price.
20.
()
The amount received from the sale of additional unit of output is known as Marginal Revenue.
21.
()
The statement is false because if average product is equal to marginal product, average product is at its maximum.
22.
()
(l) Raw materials.
(II) Labour engaged on production
23.
()
Total expenditure will rise if there is 10% rise in the price of the good since its demand is inelastic (Given ED = 0.2).
24.
(b)
25.
(a)
26.
(b)
27.
As, we know condition for consumer equilibrium is, Necessary Condition Marginal utility of last rupee spent on each commodity is same. Suppose there are two commodities, X and Y respectively. So, for commodity X, the condition is, Marginal Utility in terms of Money = Price of X
Or \(\frac { Marginal\ utility\ of\ s\ product\ in\ util[M{ U }_{ x }] }{ Marginal\ utility\ of\ one\ rupee[M{ U }_{ m }] } \)=Price of X
Or \(\frac { M{ U }_{ x } }{ { P }_{ x } } =M{ U }_{ M }\) ---------(1)
Similarly: for commodity Y, the condition is,
\(\frac { M{ U }_{ y } }{ { P }_{ y } } =M{ U }_{ M }\) -----------(2)
Putting equation (2) in (1), we get
\(\frac { M{ U }_{ x } }{ { P }_{ x } } =\frac { M{ U }_{ y } }{ { P }_{ y } } \)
But as given in the question that the ratio of marginal utility to price in case of X is higher than that in case of Y,
i.e.,\(\frac { M{ U }_{ x } }{ { P }_{ x } } >\frac { M{ U }_{ y } }{ { P }_{ y } } \)
It means marginal utility from the last rupee spent on commodity X is more than marginal utility from the last rupee spent on commodity Y. So, to attain the equilibrium consumer must increase .the quantity of X, which decreases the MUx and decreases the quantity of Y, which will increase the MU. Increase in quantity of y X and decrease in quantity of Y continue till \(\frac { M{ U }_{ x } }{ { P }_{ x } } =\frac { M{ U }_{ y } }{ { P }_{ y } } \)
28.
Calculation of Arithmetic mean by direct method
| Marks | Frequency(f) | Mid Value (M) | Frequency*Midvalue (FM) |
| 0-10 | 8 | 5 | 40 |
| 10-20 | 12 | 15 | 180 |
| 20-30 | M | 25 | 25M |
| 30-40 | 10 | 35 | 350 |
| 40-50 | 6 | 45 | 270 |
| 50-60 | 4 | 55 | 220 |
| Total | \(\sum F\) =40+M | \(\sum FM\) =1060+25M |
\(\overline { x } =A+\frac { \sum _{ i=1 }^{ n }{ { f }_{ i } } { m }_{ i } }{ \sum _{ i=1 }^{ n }{ { f }_{ i } } } \quad \quad \quad \)
26 (40+M)=1060+50M
1040+26M=1060+25M
26M-25M=1060-1040
M=20
29.
| Component | Description |
| Title | Title is a brief and clear explanation of the contains of the table |
| Table Number | A number is assigned to a table for easy identification when many tables are included |
| Date | Date of the creation of the table should be indicated |
| Row Designations | Each row of the table is given a brief name, usually provided in the first column. Such a name is known as a "stub", and the column is known as the "stub column" |
| Column Headings | Each column is given a heading to explain the nature of the figures included in each column. Such names are known as "captions" or "headings". |
| Body of the table | Data is entered into the main body and should be created for easy identification of each data items. Numeric values are often ordered in either ascending or descending order. |
| Unit of Measurement | The unit of measurement of the values in the table body should be indicated. |
| Sources | The tables should provide the primary and secondary sources for the data below the body of the table. |
| Footnotes and References | Addition details for clarifying the contents of the table. |
30.
| Mark in Economics | No. of students | Cf |
| 0-10 | 5 | 5 |
| 10-20 | 15 | 20 |
| 20-30 | 18 | 38 |
| 30-40 | 12 | 50 |
| 40-50 | 20 | 70 |
| 50-60 | 15 | 85 |
| 60-70 | 7 | 92 |
| 70-80 | 3 | 95 |
| 95 |
\(M=\frac{\frac{N}{2}-cf}{f}\times c;M=\frac{47.5-38}{12}\times10\)
\(M=30+\frac{95}{12}\)
M = 30 + 7.91
Median = 37.91
31.
(i) Selling cost is the expenses which are incurred for promoting sales or inducing customers to buy a good of a particular brand.
(ii) Theoretically, a consumer is the king because whatever he desires/ demands is produced/ supplied.
(iii) But in reality this is not so. Advertisement and salesmanship bias his mind in favour of certain commodities which otherwise may not be good.
32.
Different types of two-dimensional diagrams have been explained below: Rectangles: Since area of a rectangle is equal to the product of its length and width, while making such type of diagrams both length and width are considered. Rectangles are suitable for use in cases where two or more quantities are to be compared and each quantity is sub-divided into several components. Squares: To construct a square diagram, first the square-root of the values of various figures to be represented is taken and then these values are divided either by the lowest figure or by some other common figure to obtain proportions of the sides of the squares. The squares constructed on these proportionate lengths must have either the base or the center on a straight line. The scale is attached with the diagram to show the variable value represented by one square unit area of the squares. Circles: Circles are alternatives to squares to represent data graphically. The circles are also drawn such that their areas are in proportion to the figures represented by them. The circles are constructed in such a way that their centers lie on the same horizontal line and the distance between the circles is equal. Since the area of a circle is directly proportional to the square of its radius, the radii of the circles are obtained in proportion to the square root of the figures under representation. Thus, the lengths that were used as the sides of the square can also be used as the radii of circles.
33.
| Price(P)(Rs) | units sold(Q) | TR(Rs)=PxQ | MR(Rs)MRn=TRn-TRn-1 |
|---|---|---|---|
| 10 | 10 | 100 | 1 |
| 11 | 9 | 99 | 3 |
| 12 | 8 | 96 | 5 |
| 13 | 7 | 91 | 7 |
| 14 | 6 | 84 | 9 |
| 15 | 5 | 75 | 11 |
| 16 | 4 | 64 | - |
(i) MR is calculated in the reverse order, i.e., from bottom to top.
(ii) MR of the 4th unit has not been calculated as the total revenue from 3 units is not given.
34.
| Increase in Supply | Basis | Expansion in Supply | ||||||||
|---|---|---|---|---|---|---|---|---|---|---|
| An increase in supply means that producers now supply more at a given orice level | Meaning | It states that rise in quantity supplied due to the rise in price of the commodity | ||||||||
| (i) Fall in the price of remuneration of factors of production (ii) Fall in the prices of other goods (iii) Improvement in technology. (iv) Change in objective of producer (increase the supply at the same rate). (v) Taxation policy of government falls. |
Cause | It is caused by rise in price of the commodity. | ||||||||
|
Schedule |
|
||||||||
|
|
Diagram | 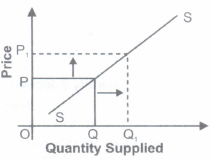 |

11th Standard CBSE Syllabus & Materials
11th Standard CBSE
CBSE 11th Business Studies Forms of Business Organisation Sample Question Papers Study Material - QB365 Set A
NEW11th Standard CBSE
CBSE 11th Business Studies Business, Trade and Commerce Sample Question Papers Study Material - QB365 Set A
NEW11th Standard CBSE
CBSE 11th Physics Waves Sample Question Papers Study Material - QB365 Set A
NEW11th Standard CBSE
CBSE 11th Physics Kinetic Theory Sample Question Papers Study Material - QB365 Set A



NCERT Books

Syllabus

Exam Pattern

Sample Question Papers

Previous year Question Papers

Important Notes

MCQ Practice test

NCERT Exemplers

Case study Questions

Image Based Questions

Passage based Questions

HOT Questions

Value Based Questions

Model Questions Papers
NCERT ( Book Back ) Questions

Assertion and Reason
Important Questions And Answers

CBSE 11th Standard CBSE Subjects
CBSE Standards