
 100% FREE ACCESS
11th Standard CBSE Syllabus & Materials
11th Standard CBSE
CBSE 11th Economics PART-A - Presentation of Data - New Sample Question Papers Study Material - QB365 Set A
NEW11th Standard CBSE
CBSE 11th Economics PART-A - Organisation of Data - New Sample Question Papers Study Material - QB365 Set A
NEW11th Standard CBSE
CBSE 11th Economics PART-A - Collection of Data - New Sample Question Papers Study Material - QB365 Set A
NEW11th Standard CBSE
CBSE 11th Economics PART-A - Introduction to Economics and Statistics - New Sample Question Papers Study Material - QB365 Set A
NEW11th Standard CBSE
CBSE 11th Business Studies International Trade Sample Question Papers Study Material - QB365 Set A
NEW11th Standard CBSE
CBSE 11th Business Studies Evolution and Fundamentals of Business Sample Question Papers Study Material - QB365 Set A

Published on: 21/10/2025
Download CBSE Class 11th Standard CBSE undefined question papers, sample papers, important questions, and previous year solved papers in PDF format. Get free study materials, NCERT solutions, and exam preparation resources for Class 11th Standard CBSE undefined
Questions + Answers key
Take MCQ Biology Test
1.
X and Y are complementary goods. The price of Y falls. Explain the chain of effects of this change in the market of X.
2.
Which values are of utmost importance in making of a project?
3.
From the data given below, find Mean Deviation and coefficient of MD. from median.
| Marks obtained | No. of students |
| Less than 10 | 3 |
| Less than 20 | 5 |
| Less than 30 | 10 |
| Less than 40 | 18 |
| Less than 50 | 25 |
| Less than 60 | 30 |
| Marks obtained (class interval) |
No of students | cumulative Frequency | Mid Value | |M-Median| | (F|M-Median|) |
| 0-10 | 3=3-0 | 3 | 5 | 31.25 | 93.75 |
| 10-20 | 2=5-3 | 5 | 15 | 21.25 | 42.50 |
| 20-30 | 5=10-5 | 10 | 25 | 11.25 | 56.25 |
| 30-40 | 8=18-10 | 18 | 35 | 1.25 | 10.00 |
| 40-50 | 7=25-18 | 25 | 45 | 8.25 | 57.75 |
| 50-60 | 5=30-25 | 30 | 55 | 18.75 | 93.75 |
| Total | \(\sum\)F=30 | \(\sum\)(F|M-Median|)=354 |
4.
Explain different ways of classifying data.
5.
Karl Pearson's Method is superior to Rank Correlation. Do you agree? Justify your answer.
6.
Given below is the cost schedule of a product produced by a firm. The market price per unit of the product at all levels of output is Rs 12 .Using Marginal Cost and Marginal Revenue approach, find out the level of equilibrium output. Give reasons for your answer.
| Output (units) | 1 | 2 | 3 | 4 | 5 | 6 |
| Average cost (Rs) | 12 | 11 | 10 | 10 | 10.4 | 11 |
7.
Compare between perfect competition and monopolistic competition.
8.
Differentiate between Economics as a positive and as a normative Science.
9.
There is given the market price of a piece of goods, how does a consumer decides as to how many units of that piece of goods to buy
10.
Discuss the central problems of an economy
1.
As given in the examination problem that market for a good is in equilibrium. So, we assume that initial price is OP as shown in the figure.
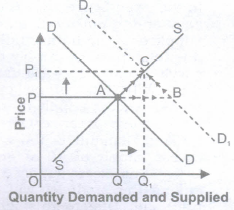
In the given figure price is on vertical axis and quantity demanded and supplied are on horizontal axis. But due to increase in demand, demand curve shifts rightward from DD to D1D1. With new demand curve D1D1 there is excess demand at initial price OP because at price OP, demand is PB and supply is PA, so there is excess demand of AB at price OP. Due to this excess demand, competition among the consumer will rise the price. With the rise in price, there is upward movement along the demand curve (contraction in demand) from B to C and similarly, there is upward movement along the supply curve (expansion in supply) from A to C. So, finally equilibrium price rises from OP to OP1 and equilibrium quantity also rises from OQ to OQ1.
Conclusion
Due to increase in demand,
(i) Equilibrium price rises from OP to OP1
(ii) Equilibrium quantity also rises from OQ to OQ1
2.
(a) Originality: Project must not be copied but an original work of investigator.
(b) Sample Selection: Sample must be randomly selected. There must not be any bias in selection of the sample else the entire motto of preparing project will defeat.
(c) Decision Making: Many decisions are required to be taken in making of a project. Therefore, decision making is another important value.
(d) Communication Skills: In order to get information from people, one needs to be tactful. It calls for good communication skills.
3.
Median = size of \(\frac { N }{ 2 } \)Item
Median = size of \(\frac { 30 }{ 2 } \)=15 item 15thitem lies in 30-40
We can find median by using the formula equal to
Median = l1+\(\frac { \left( N/2-C \right) }{ f } \)(i)
Where l1=30; f=8; \(\frac{N}{2}\)=15; C=10; i=10
l1=30+\(\frac { \left( 15-10 \right) }{ 8 } \)(10)=36.25
M.D. From Mean =\(\frac { \sum { F } |X-Median| }{ \sum { F } } \)
Coefficient of M.D. from Mean =\(\frac { M.D.fromMean }{ Mean } \)=\(\frac { 11.8 }{ 36.25 } \)=0.325
4.
Generally, data are classified on the basis of the following four bases:
Geographical Classification:
In geographical classification, data are classified on the basis of geographical or locational differences - such as cities, districts, or villages - between various elements of the data set. The following is an example of a geographical distribution. (Figures are hypothetical)
| States of India | Punjab | Haryana | J & K | Bihar | Orissa | M.P. |
| Poverty (%) |
12 | 10 | 3.5 | 39 | 38 | 34 |
Chronological Classification:
When data are classified on the basis of time, the classification is known as chronological classification. Such classifications are also called time series because data are usually listed in chronological order starting with the earliest period. The following is an example of a Chronological distribution. (Figures are hypothetical)
| Year | 1951 | 1961 | 1971 | 1981 | 1991 | 2001 |
| Poverty (%) | 52 | 50 | 47 | 38 | 36 | 26 |
Another example can be:
| Month | Family expenditure per member |
| January | 2000 |
| February | 3000 |
| March | 1000 |
| April | 1200 |
| May | 2300 |
| June | 1400 |
| July | 1100 |
| August | 4300 |
| September | 900 |
| October | 1900 |
| November | 2100 |
| December | 3100 |
Qualitative Classification:
In qualitative classification, data are classified on the basis of descriptive characteristics or on the basis of attributes like sex, literacy, region, caste, or education, which cannot be quantified. This is done in two ways:
Simple classification:
In this type of classification, each class is subdivided into two sub-classes and only one attribute is studied, for example male and female; blind and not blind, educated and uneducated; and so on.
Manifold classification: In this type of classification, a class is subdivided into more than two subclasses which may be sub-divided further. An example is given below:
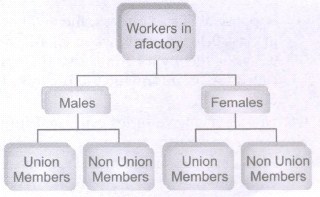
Quantitative Classification: In this classification, data are classified on the basis of characteristics which can be measured such as height, weight, income, expenditure, production, or sales. An example is given below:
| Salary Per Month | No. of workers |
| 0-10000 | 40 |
| 10,000-20,000 | 10 |
| ·20000-30000 | 13 |
| 30000-40000 | 8 |
| 40,000-50,000 | 12 |
| 50,000 and above | 7 |
5.
The Pearson correlation coefficient is the most widely used. It measures the strength of the linear relationship between normally distributed variables. When the variables are not normally distributed or the relationship between the variables is not linear, it may be more appropriate to use the Spearman rank correlation method. It gives an answer for any number fo figures while rank correlation can't be used if n 'is more than 30.
(a) If many numbers are repeating, it becomes still more difficult to use rank correlation.
(b) But if we do not know the figures but ranks, then it is advisable to use rank correlation.
6.
| Output (Q)(in units) | Price (P)(Rs) | AC(Rs) | Marginal Revenue(MR)(Rs) | TC(Rs) | MC(Rs) |
| 1 | 12 | 12 | 12 | 12 | - |
| 2 | 12 | 11 | 12 | 22 | 10 |
| 3 | 12 | 10 | 12 | 30 | 8 |
| 4 | 12 | 10 | 12 | 40 | 10 |
| 5 | 12 | 10.4 | 12 | 52 | 12 |
| 6 | 12 | 11 | 12 | 66 | 14 |
The producer will be at equilibrium at 5 units of output which satisfy both the conditions of producer's equilibrium.
(i) MC = MR
(ii) MC must be rising.
7.
| Perfect Competition | Basis | Monopolistic Competition |
|---|---|---|
| It refers to a market situation where there are very large number of buyers and sellers dealing in a homogeneous product at a price fixed by the market. |
Meaning | It refers to a market situation in which there are large number of firms selling closely related but differentiated products. |
| The products sold are homogeneous. So, buyers are willing to pay same price for all products, which leads to uniform price in the market. | Nature of Product | Products are differentiated on the basis of brand, size, colour, shape etc. So, a firm is in a position to influence the price. |
| Demand curve is perfectly elastic as price remains the same at all levels of output. | Demand Curve | Demand curve slopes downwards as more output can be sold only at less price. |
| Firm is a price-taker as price is determined by the industry. | Price | Firm is neither a price-taker nor a price-maker but has partial control over price due to product differentiation. |
| Buyers and sellers have perfect knowledge about market conditions. | Level of Knowledge | Sellers and buyers do not have perfect knowledge due to product differentiation and selling costs incurred by the sellers. |
| No selling costs are incurred as buyers and sellers have perfect knowledge about market conditions. | Selling Cost | Heavy selling costs are incurred on sales promotion due to lack of perfect knowledge among buyers and sellers. |
8.
| Basis | Positive Economics | Normative Economics |
| Meaning | It deals with laws, principles, theories and facts of economics. | It deals with opinions, policy evaluation and idealistic part of economics. |
| Reality vs. Idealism | It deals with reality, i.e. 'what is'. | It deals with idealistic situation, i.e. 'What ought to be' |
| Value Judgments | No value judgments are associated with positive economics | Value judgments are associated with normative economics |
| Example | (a) There is inverse relation between price and quantity demanded other things being equal. (b) In India, 34% marginal farmers are living below poverty line. (c) MGNREGA was launched in 2005. |
(a) Globalization is widening the gap between countries. (b) Poverty is worse than unemployment (c) Price rise is disastrous for the economy (d) We should not give subsidies on fertilizers |
9.
(a) When purchasing a unit of a commodity a consumer compares its price with the expected utility from it. Utility obtained is the benefit, and the price payable is the cost. The consumer compares benefit and the cost. He will buy the unit of a commodity only if the benefit is greater than or at least equal to the cost.
(b) equilibrium Conditions for Single Commo ·ty Consumer Equilibrium Necessary Condition Marginal utility in terms of Money = Price
\(\frac { Marginal\ utility\ of\ a\ product\ in\ utils[M{ U }_{ X }] }{ \ utility\ of\ one\ rupee[M{ U }_{ M }] } \)
In particular, the condition (A) says that the marginal utility of a Product in terms of Money be equal to its price. Sometimes, this is loosely stated as marginal utility is equal to price, i.e.,
| Consumption(Un-its) | Marginal Utility(MU)(Uti-Ls) | M.U.(Rs) | Price | Marginal Gain(MU-Price) | Total Gain |
|---|---|---|---|---|---|
| 1 | 5 | 5 | 3 | 2 | 2 |
| 2 | 4 | 4 | 3 | 1 | 3 |
| 3 | 3 | 3 | 3 | 0 | 3 |
| 4 | 2 | 2 | 3 | -1 | 2 |
(b) Suppose, the price of commodity X in the market is Rs.3 per unit. It means he has to pay Rs.3 per unit for all the units he buys. Suppose, the utility obtained from the first unit is 5 utils (=Rs. 5). The consumer will buy this unit because the utility of this unit is greater than the price and this process continues till Marginal utility = Price as shown in the above schedule at quantity 3.
(c) Consumer will not buy the fourth unit MU = Price.
If MU> PRICE
(a) Means benefit is greater than cost and whenever benefit is greater than cost, consumer keeps on consuming additional unit of a commodity till MU = Price.
(b) It is so because according to the law of diminishing marginal utility, MUfalls as more is purchased till it becomes equal to price.
If MU< PRICE
(a) Means benefit is less than cost and whenever benefit is less than cost, the consumer keeps on decreasing additional unit of a commodity till MU = Price.
(b) It is so because according to the law of diminishing marginal utility, MU rises as less units are consumed till it becomes equal to price.
Sufficient Condition
Total gain falls as more is purchased after equilibrium. It means that consumer continues to purchase so long as total gain is increasing or at least constant.
(a) It can be explained with the help of the following schedule:
because utility of this unit is 2 utils (= Rs.2) which is less than the price. It is not worth buying the fourth unit. The consumer will restrict his purchase to only 3 units
10.
The three central problems of an economyare:
(i) What to produce?
(a) What to produce refers to a problem in which decision regarding which goods and services should be produced is to be taken.
(b) Since its resources are limited, every economy has to decide what commodities are to be produced and in what quantities.
(c) The guiding principle for an economy here is to allocate resources in such a way that gives maximum aggregate utility to the society.
(ii) How to produce?
(a) How to produce refers to a problem in which decision regarding which technique of production should be used is made.
(b) Goods and services can be produced in two ways: by using labour intensive techniques, and by using capital-intensive techniques
(c) The guiding principle for an economy in such a case has to decide about the techniques of production on the basis of cost of production. Those techniques of production should be used which lead to the least possible cost per unit of commodity or service.
(iii) For whom to produce?
(a) For whom to produce refers to a problem in which decision regarding which category of people are going to consume a good, i.e., economically poor or rich.
(b) As we know, goods and services are produced for those who can purchase them or have the capacity to buy them.
(c) Capacity to buy depends upon how income is distributed among the factors of production. The higher the income, the higher will be the capacity to buy and vice versa. So, this is a problem of distribution.
(d) The guiding principle is that the economy must see here that important and urgent wants of its citizens are being satisfied for the maximum possible extent or not.

11th Standard CBSE Syllabus & Materials
11th Standard CBSE
CBSE 11th Business Studies Forms of Business Organisation Sample Question Papers Study Material - QB365 Set A
NEW11th Standard CBSE
CBSE 11th Business Studies Business, Trade and Commerce Sample Question Papers Study Material - QB365 Set A
NEW11th Standard CBSE
CBSE 11th Physics Waves Sample Question Papers Study Material - QB365 Set A
NEW11th Standard CBSE
CBSE 11th Physics Kinetic Theory Sample Question Papers Study Material - QB365 Set A



NCERT Books

Syllabus

Exam Pattern

Sample Question Papers

Previous year Question Papers

Important Notes

MCQ Practice test

NCERT Exemplers

Case study Questions

Image Based Questions

Passage based Questions

HOT Questions

Value Based Questions

Model Questions Papers
NCERT ( Book Back ) Questions

Assertion and Reason
Important Questions And Answers

CBSE 11th Standard CBSE Subjects
CBSE Standards