
 100% FREE ACCESS
9th Standard CBSE Syllabus & Materials
9th Standard CBSE
CBSE 9th Science Is matter around us pure? - New Model Questions Papers Study Material - QB365 Set A
NEW9th Standard CBSE
CBSE 9th Science Matter in our surroundings - New Model Questions Papers Study Material - QB365 Set A
NEW9th Standard CBSE
CBSE 9th Mathematics Heron's Formula Sample Question Papers Study Material - QB365 Set A
NEW9th Standard CBSE
CBSE 9th Mathematics Circles Sample Question Papers Study Material - QB365 Set A
NEW9th Standard CBSE
CBSE 9th Mathematics Quadrilaterals Sample Question Papers Study Material - QB365 Set A
NEW9th Standard CBSE
CBSE 9th Mathematics Triangles Sample Question Papers Study Material - QB365 Set A

Published on: 29/10/2025
Download CBSE Class 9th Standard CBSE Mathematics question papers, sample papers, important questions, and previous year solved papers in PDF format. Get free study materials, NCERT solutions, and exam preparation resources for Class 9th Standard CBSE Mathematics
Questions + Answers key
Take MCQ Mathematics Test
1.
Find the mean salary of 60 workers of a factory from the following table:
| Salary (in Rs) | Number of workers |
|---|---|
| 3000 | 16 |
| 4000 | 12 |
| 5000 | 10 |
| 6000 | 8 |
| 7000 | 6 |
| 8000 | 4 |
| 9000 | 3 |
| 1000 | 1 |
| Total | 60 |
2.
Find the mode of 14,25,14,28,18,17,18,14,23,22,14,18
3.
The length of 40 leaves of a plant are measured a correct one millimeter, and the obtained data is represented in the following table:
| Length (in mm) | Number of leaves |
| 118-126 | 3 |
| 127-135 | 5 |
| 136-144 | 9 |
| 145-153 | 12 |
| 154-162 | 5 |
| 163-171 | 4 |
| 172-180 | 2 |
(i) Draw a histogram to represent the given data.
(ii) Is there any suitable graphical representation for the same data?
(iii) Is it correct to conclude that the maximum number of leaves are 153 mm long? Why?
4.
Given below are the seats won by different political parties in the polling outcome of a state assembly elections:
| Political Party | A | B | C | D | E | F |
| Seat won | 75 | 55 | 37 | 29 | 10 | 37 |
(i) Draw a bar graph to represent the polling results.
(ii) Which political party won the maximum number of seats?
5.
The following data on the number of girls (to the nearest ten) per thousand boys in different sections of the Indian society is given below:
| Section | Number of girls per thousand boys |
| Scheduled Caste (SC) | 940 |
| Scheduled Tribe (ST) | 970 |
| Non SC/ST | 920 |
| Backward districts | 950 |
| Non-backward districts | 920 |
| Rural | 930 |
| Urban | 910 |
(i) Represent the information above by a bar graph.
(ii) In the classroom discuss what conclusion can be arrived at from the graph.
6.
The blood groups of 30 students of Class VIII are recorded as follows:
A,B,O,O,AB,O,A,O,B,A,O,B, A,O,O,
A,AB,O,A,A,O,O,AB,B,A,O,B,A,B,O.
Represent this data in the form of a frequency distribution table. Which is the most common and which is the rarest, blood group among these students.
7.
Classify the data as primary or secondary data.
(i) Number of students
(ii) Number of fans un our school.
(iii) Electricity bills of our house for last two years.
(iv) Election results obtained from television or newspaper.
(v) Literacy rate figures obtained from Educational Survey.
8.
The heights (in cm) of students of a class are as follows:
155 160 145 149 150 147 152 144 148
Find the median of this data.
9.
Consider the marks, out of 100, obtained by 51 students of a class in a test:
| Marks | Number of students |
|---|---|
| 0-10 | 5 |
| 10-20 | 10 |
| 20-30 | 4 |
| 30-40 | 6 |
| 40-50 | 7 |
| 50-60 | 3 |
| 60-70 | 2 |
| 70-80 | 2 |
| 80-90 | 3 |
| 90-100 | 9 |
| Total | 51 |
Draw a frequency polygon corresponding to this frequency distribution table.
10.
In a city, the following weekly observations were made in a study on the cost of living index.
| Cost of living index | Number of weeks |
|---|---|
| 140-150 | 5 |
| 150-160 | 10 |
| 460-170 | 20 |
| 170-180 | 9 |
| 180-190 | 6 |
| 190-200 | 2 |
| Total | 52 |
Draw a frequency polygon for the data above (without constructing a histogram).
11.
In a particular section of Class IX, 40 students were asked about the month of their birth, the following was prepared for the data so obtained.
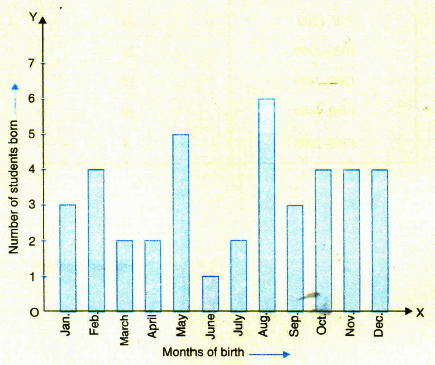
Observe the bar graph given above and answer the following question:
(i) How many students were born in the month of November?
(ii) In which month were the maximum number of students born?
12.
Three coins were tossed 30 times simultaneously. Each time, the number of heads occurring was noted drawn as follows:
| 0 | 1 | 2 | 2 | 1 |
| 2 | 3 | 1 | 1 | 0 |
| 1 | 3 | 1 | 1 | 2 |
| 2 | 0 | 1 | 2 | 1 |
| 3 | 0 | 0 | 1 | 1 |
| 2 | 3 | 2 | 2 | 0 |
Prepare a frequency distribution table for the data given above.
13.
The following table gives the life times of 400 neon lamps:
| Lifetime (in years) | Number of Lamps |
|---|---|
| 300-400 | 14 |
| 400-500 | 56 |
| 500-600 | 60 |
| 600-700 | 86 |
| 700-800 | 74 |
| 800-900 | 62 |
| 900-1000 | 48 |
(i) Represent the given information with the help of a histogram.
(ii) How many lamps have a life time of more than 700 hours?
14.
The heights of 50 students, measured to the nearest centimetres have been found to be as follows
| 161 | 150 | 154 | 165 | 168 | 161 | 154 | 162 | 150 | 151 |
| 162 | 164 | 171 | 165 | 158 | 154 | 156 | 172 | 160 | 170 |
| 153 | 159 | 161 | 170 | 162 | 165 | 166 | 168 | 165 | 164 |
| 154 | 152 | 153 | 156 | 158 | 162 | 160 | 161 | 173 | 166 |
| 161 | 159 | 162 | 167 | 168 | 159 | 158 | 153 | 154 | 159 |
(i) Represent the data given above by a grouped frequency distribution table, taking c ss intervals as 160-165, 165-170 etc.
(ii) What can you conclude about their heights from the table?
15.
The relative humidity (in %) of a certain city for a month of 30 days was as follows
| 98.1 | 98.6 | 99.2 | 90.3 | 86.5 | 95.3 | 92.9 | 96.3 | 94.2 | 95.1 |
| 89.2 | 92.3 | 97.1 | 93.5 | 92.7 | 95.1 | 97.2 | 93.3 | 95.2 | 97.3 |
| 96.2 | 92.1 | 84.9 | 90.2 | 95.7 | 98.3 | 97.3 | 96.1 | 92.1 | 89.0 |
(i) Construct a grouped frequency distribution table with classes 84-86, 86-88 etc.
(ii) Which month or season do you think this data is about?
(iii) What is the range of this data?
16.
The distance (in km) of 40 engineers from their residence to their place of work were found as follows
| 5 | 3 | 10 | 20 | 25 | 11 | 13 | 7 | 12 | 31 |
| 19 | 10 | 12 | 17 | 18 | 11 | 32 | 17 | 16 | 2 |
| 7 | 9 | 7 | 8 | 3 | 5 | 12 | 15 | 18 | 3 |
| 12 | 14 | 2 | 9 | 6 | 15 | 15 | 7 | 6 | 12 |
Construct a grouped frequency distribution table with class size 5 for the data given above taking the first interval as 0-5 (5 is not included). What main features do you observe from this tabular representation?
1.
| Salary (in Rs) \((x_i)\) | Number of workers \((f_i)\) | \(f_ix_i\) |
|---|---|---|
| 3000 | 16 | 48000 |
| 4000 | 12 | 48000 |
| 5000 | 10 | 50000 |
| 6000 | 8 | 48000 |
| 7000 | 6 | 42000 |
| 8000 | 4 | 32000 |
| 9000 | 3 | 27000 |
| 10000 | 1 | 10000 |
| Total | \(\sum _{ i=1 }^{ 8 }{ { f }_{ i } } =60\) | \(\sum _{ i=1 }^{ 8 }{ { f }_{ i }\times { x }_{ i } } \) =305000 |
\(\therefore\) \(\overset { - }{ x } =\frac { \sum _{ i=1 }^{ 8 }{ { f }_{ i }{ x }_{ i } } }{ \sum _{ i=1 }^{ 8 }{ { f }_{ i } } } =\frac { 305000 }{ 60 } \) = Rs 5083.33
Hence, the mean salary is Rs 5083.33.
2.
The given data is
14,25,14,28,18,17,18,14,23,22,14,18
Arranging the data in ascending order, we have
14,14,14,14,17,18,18,18,22,23,25,28
Here, 14 occurs most frequently (4 times)
\(\therefore\) Mode = 14.
3.
Modified Continues Distribution
| Length (in mm) | Number of leaves |
| 117.5-126.5 | 3 |
| 126.5-135.5 | 5 |
| 135.5-144.5 | 9 |
| 144.5-153.5 | 12 |
| 153.5-162.5 | 5 |
| 162.5-171.5 | 4 |
| 171.5-180.5 | 2 |
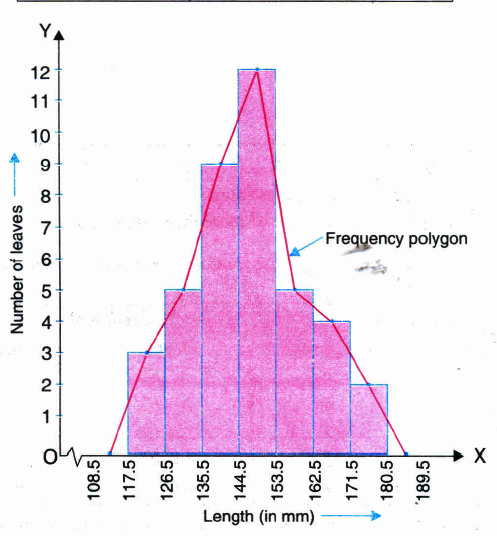
(ii) Frequency Polygon.
(iii) No, because the maximum number of leaves have their lengths lying in the original interval 145-153 (or modified interval 144.5-153.5).
4.
(i)
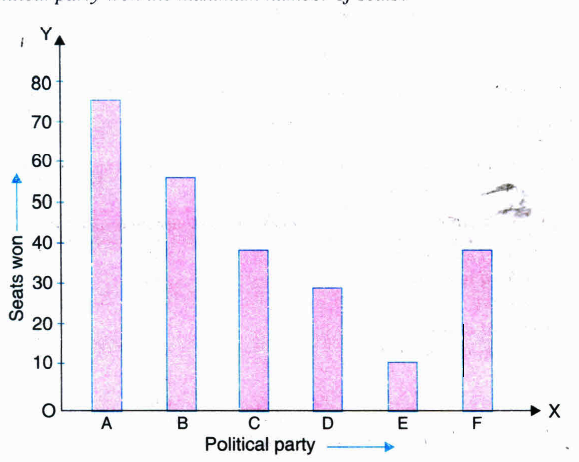
(ii) Political party A won the maximum number of seats.
5.
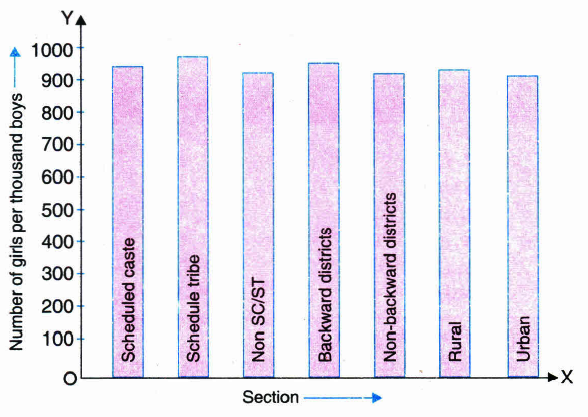
(ii) The two conclusions we can arrive at from the graph are as follows:
(a) The numbers of girls to the nearest ten per thousand boys is maximum in Scheduled Tribe section of the society and minimum in Urban section of the society.
(b) The number of girls to the nearest ten per thousand boys is the same for 'Non Sc/ST' and 'Non-backward Districts' sections of the society.
6.
O is the most common and AB is the rarest blood group among these students.
7.
(i), (ii) and (iii) are primary data
(iv) and (v) are secondatary data.
8.
First of all we arrange the data in ascending order, as follows:
144 145 147 148 149 150 152 155 160
Since the number of students is 9, an odd number, we find out the median by finding the height of the \(\left(\frac{n+1}{2}\right) \text { th }=\left(\frac{9+1}{2}\right) \text { th }\) the 5th student, which is 149 cm.
So, the median, i.e., the medial height is 149 cm.
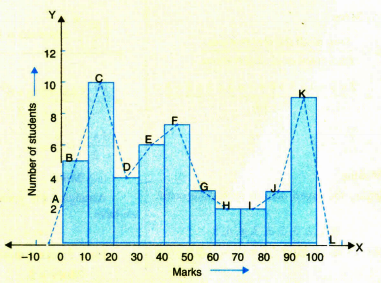
9.
Let us first draw a histogram for this data and mark the mid-points of the tops of the rectangles as B, C, D, E, F, G, H, I, J, K, respectively. Here, the first class is 0-10. So, to find the class preceeding 0-10, we extend the horizontal axis in the negative direction and find the mid-point of the imaginary class-interval (–10) - 0. The first end point, i.e., B is joined to this mid-point with zero frequency on the negative direction of the horizontal axis. The point where this line segment meets the vertical axis is marked as A. Let L be the mid-point of the class succeeding the last class of the given data. Then OABCDEFGHIJKL is the frequency polygon, which is shown in Fig.
10.
Since we want to draw a frequency polygon without a histogram, let us find the class-marks of the classes given above, that is of 140 - 150, 150 - 160,....
For 140 - 150, the upper limit = 150, and the lower limit = 140
So, the class-mark = \(\frac{150+140}{2}=\frac{290}{2}=145\)
| Classes | Class Marks | Frequency |
|---|---|---|
| 140-150 | 145 | 5 |
| 150-160 | 155 | 10 |
| 160-170 | 165 | 20 |
| 170-180 | 175 | 9 |
| 180-190 | 185 | 6 |
| 190-200 | 195 | 2 |
| Total | 52 |
We can now draw a frequency polygon by plotting the class-marks along the horizontal axis, the frequencies along the vertical-axis, and then plotting and joining the points B(145, 5), C(155, 10), D(165, 20), E(175, 9), F(185, 6) and G(195, 2) by line segments. We should not forget to plot the point corresponding to the class-mark of the class 130 - 140 (just before the lowest class 140 - 150) with zero frequency, that is, A(135, 0), and the point H (205, 0) occurs immediately after G(195, 2). So, the resultant frequency polygon will be ABCDEFGH.

11.
(i) 4 students were born in the month of November.
(ii) Maximum number of students were born in the month of August.
12.
| 0 | 6 |
| 1 | 11 |
| 2 | 9 |
| 3 | 4 |
13.
| Lifetime (in yours) | Class Marks | Number of lapms (frequency) |
|---|---|---|
| 300-400 | 350 | 14 |
| 400-500 | 450 | 56 |
| 500-600 | 550 | 60 |
| 600-700 | 650 | 86 |
| 700-800 | 750 | 74 |
| 800-900 | 850 | 62 |
| 900-1000 | 950 | 48 |
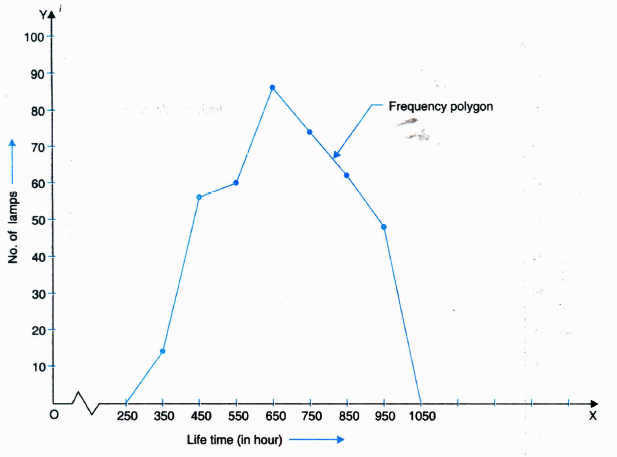
(ii) 74 + 62 + 48 = 184 have a life time of more than 700 hours
14.
(i) We condense the given data into groups like 150-155, 155-160, ... , 170-175 (since, our data is from 150 to 172). The class width in this case is 5. Now, the given data can be condensed in tabular form as follows
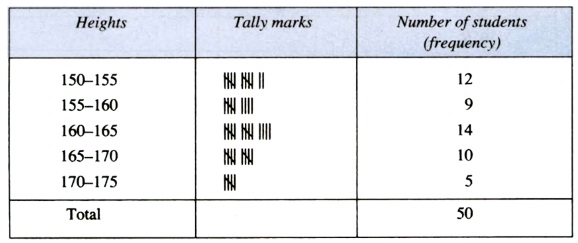
(ii) From the table, our conclusion is that more than 50% of students (i.e. 12 + 9 + 14 = 35) are shorter than 165 cm height.
15.
(i) We condense the given data into groups, like 84-86, 86-88, ... , 98-100 (since, our data is from 84.9 to 99.2). So, the class width in this case is 2.
Now, the given data can be condensed in tabular form as follows
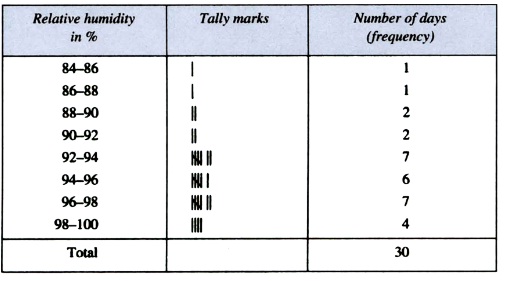
(ii) From the table, we observe that the data appears to be taken in the rainy season as the relative humidity is high.
(iii) We know that, Range = Upper limit of data - Lower limit of data
= 99.2- 84.9 = 14.3
16.
To present such a large amount of data, so that a reader can make sense of it easily, we condense it into groups like 0-5, 5-10, ..., 30-35 (since, our data is from 5 to 32). Now, using tally marks, the data (given) can be condensed in tabular form as
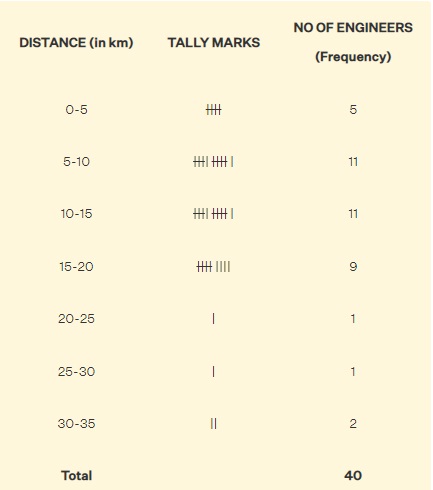
From the above table, we observe that
(i) frequencies of class intervals 5-10 and 10-15 are equal, i.e. 11 each. It shows that the maximum number of engineers have their residences within the distance of 5 to 15 km from their workplace.
(ii) frequencies of class intervals 20-25 and 25-30 are also equal, i.e. 1 each. It shows that the minimum number of engineers have their residences within 20 to 30 km from their workplace.

9th Standard CBSE Syllabus & Materials
9th Standard CBSE
CBSE 9th Mathematics Lines and Angles Sample Question Papers Study Material - QB365 Set A
NEW9th Standard CBSE
CBSE 9th Mathematics Introduction to Euclid's Geometry Sample Question Papers Study Material - QB365 Set A
NEW9th Standard CBSE
CBSE 9th Mathematics Linear Equations in Two Variables Sample Question Papers Study Material - QB365 Set A
NEW9th Standard CBSE
CBSE 9th Mathematics Coordinate Geometry Sample Question Papers Study Material - QB365 Set A



NCERT Books

Syllabus

Exam Pattern

Sample Question Papers

Previous year Question Papers

Important Notes

MCQ Practice test

NCERT Exemplers

Case study Questions

Image Based Questions

Passage based Questions

HOT Questions

Value Based Questions

Model Questions Papers
NCERT ( Book Back ) Questions

Assertion and Reason
Important Questions And Answers

CBSE 9th Standard CBSE Subjects
CBSE Standards