
 100% FREE ACCESS
9th Standard CBSE Syllabus & Materials
9th Standard CBSE
CBSE 9th Science Is matter around us pure? - New Model Questions Papers Study Material - QB365 Set A
NEW9th Standard CBSE
CBSE 9th Science Matter in our surroundings - New Model Questions Papers Study Material - QB365 Set A
NEW9th Standard CBSE
CBSE 9th Mathematics Heron's Formula Sample Question Papers Study Material - QB365 Set A
NEW9th Standard CBSE
CBSE 9th Mathematics Circles Sample Question Papers Study Material - QB365 Set A
NEW9th Standard CBSE
CBSE 9th Mathematics Quadrilaterals Sample Question Papers Study Material - QB365 Set A
NEW9th Standard CBSE
CBSE 9th Mathematics Triangles Sample Question Papers Study Material - QB365 Set A

Published on: 29/10/2025
Download CBSE Class 9th Standard CBSE Mathematics question papers, sample papers, important questions, and previous year solved papers in PDF format. Get free study materials, NCERT solutions, and exam preparation resources for Class 9th Standard CBSE Mathematics
Questions + Answers key
Take MCQ Mathematics Test
1.
If the mean of the data \(x_1,x_2,x_3,......x_n\) is 72, find the mean of the data \(3x_1,3x_2,...3x_n\)
2.
Find the median of the following data 15,28,72,56,44,32,31,43 and 51. If 32 is replaced by 23, find the new median.
3.
5 people were asking about the time in a week they spend in doing social work in their community. They said 10,7,13,20 and 15 hours, respectively. Find the mean (or average) time in a week denoted by them social work
4.
The marks obtained out of 75 by 30 students of a class in an examination are given below:
42,21,50,37,42,37,38,42,49,52,38,53,57,47,29,59,61,33,17,17,39,44,42,39,14,7,27,19,54,51
Prepare a frequency distribution table in which the size of class intervals is the same and one class intervalis 0-10.
5.
The following observations have been arranged in ascending order. If the median of the data is 63, find the value of x.
29,32,48,50,x,x+2,72,78,84,95
6.
The following number of goals were scored by a term in a series of 10 matches:
2,3,4,5,0,1,3,3,4,3
Find the mean, median and mode of these scores.
7.
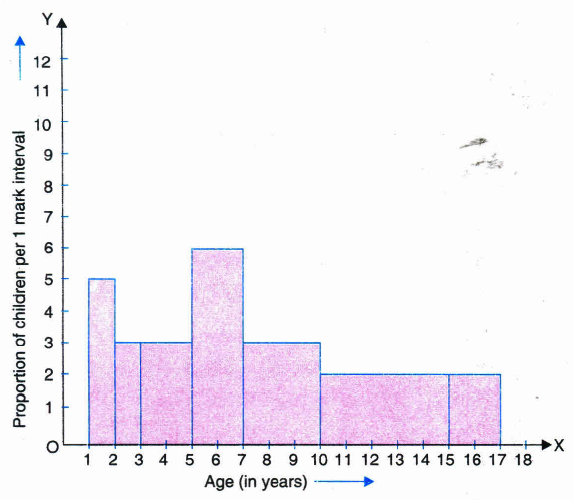
A random survey of the number of children of various age groups playing in a park was found as follows:
| Age (in years) | Number of children |
| 1-2 | 5 |
| 2-3 | 3 |
| 3-5 | 6 |
| 5-7 | 12 |
| 7-10 | 9 |
| 10-15 | 10 |
| 15-17 | 4 |
Draw a histogram to represent the data above.
8.
Given below are the seats won by different political parties in the polling outcome of a state assembly elections:
| Political Party | A | B | C | D | E | F |
| Seat won | 75 | 55 | 37 | 29 | 10 | 37 |
(i) Draw a bar graph to represent the polling results.
(ii) Which political party won the maximum number of seats?
9.
Draw a frequency polygon for the data given below, without drawing a histogram.
| Classes | Frequency |
|---|---|
| 150 -160 | 5 |
| 160 -170 | 15 |
| 170 -180 | 20 |
| 180 -190 | 25 |
| 190 - 200 | 15 |
| 200 - 210 | 5 |
10.
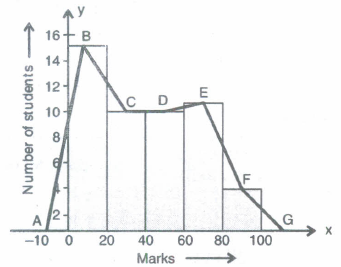
Consider the marks out of 100, obtained by 50 students of a class in a test, given as below.
| Marks | 0-20 | 20-40 | 40-60 | 60-80 | 80-100 |
|---|---|---|---|---|---|
| No. of students | 15 | 10 | 10 | 11 | 4 |
Draw a frequency polygon representing the data
11.
The mean of 200 items was 50. Later on, it was discovered that the two items were misread as 92 and 8 instead of 192 and 88. Find the correct mean.
12.
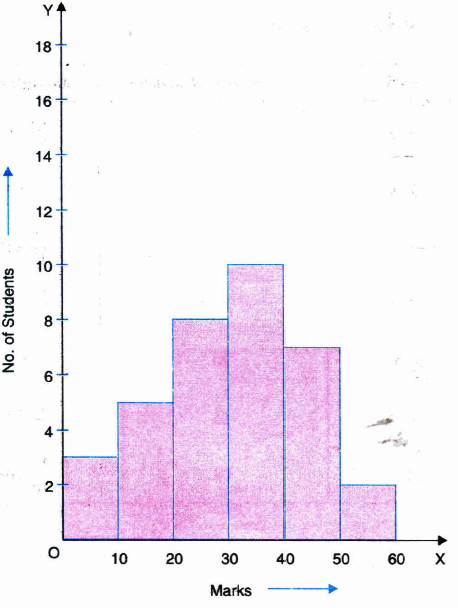
Draw a histogram representing the following frequency distribution:
| Marks | No. of students |
| 0-10 | 3 |
| 10-20 | 5 |
| 20-30 | 8 |
| 30-40 | 10 |
| 40-50 | 7 |
| 50-60 | 2 |
13.
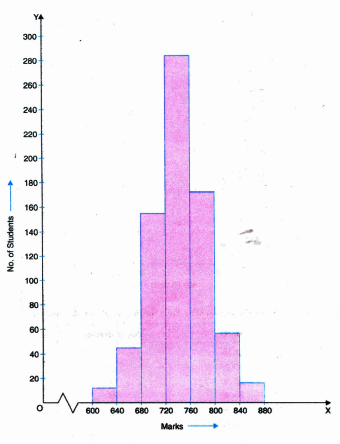
The marks scored by 750 students in examination are given in the form a frequency distribution table.
| Marks | No. of students |
| 600-640 | 16 |
| 640-680 | 45 |
| 680-720 | 156 |
| 720-760 | 284 |
| 760-800 | 172 |
| 800-840 | 59 |
| 840-880 | 18 |
Draw a histogram to represent the above data.
14.
The upper limit of the class 36 - 40 is
36
38
40
41.
15.
When the information is gathered from a source which already had the information stored, the data obtained is called
Primary data
Secondary data
Useless data
fictitious data
16.
'Number of absentees in each day in your class for a month' form
Useless data
Fictitious data
Secondary data
Primary data
17.
Statistics is branch of
Mathematics
Physics
Chemistry
Psychology
18.
The word 'Latum' is a
Latin word
German word
English word
Sanskrit word
19.
The class-mark of the class 130-150 is
20.
The range of the data is: 25,18,20,22,16,6,17,12,30,32,10,19,8,11,20 is:
21.
Find the range of the data: 22,25,20,32,36,28,40,45,35,38
22.
The points scored by a basketball team in a series of matches are as follows: 17,2,7,17,25,514,18,10. Find range.
23.
Find the mode of the numbers: 14,14,15,27,26,27,27,22,13
1.
216
2.
43,43
3.
13 hours.
4.
| Class | Frequency |
| 0-10 | 1 |
| 10-20 | 4 |
| 20-30 | 3 |
| 30-40 | 7 |
| 40-50 | 7 |
| 50-60 | 7 |
| 60-70 | 1 |
| Total | 30 |
5.
Number of observations (n) = 10, which is even.
\(\therefore\) Median
\(=\frac { { \left( \frac { n }{ 2 } \right) }^{ th }observation+{ \left( \frac { n }{ 2 } +1 \right) }^{ th }observation }{ 2 } \)
\(=\frac { { \left( \frac { 10 }{ 2 } \right) }^{ th }observation+{ \left( \frac { 10 }{ 2 } +1 \right) }^{ th }observation }{ 2 } \)
\(=\frac { { 5 }^{ th }observation+{ 6 }^{ th }observation }{ 2 } \)
\(=\frac { x+\left( x+2 \right) }{ 2 } =x+1\)
According to the question,
x + 1 = 63
\(\Rightarrow\) x = 63 - 1
\(\Rightarrow\) x = 62
Hence, the value of x is 62.
6.
(i) Mean
\(Mean = \frac { Sum\ of\ all\ the\ observations }{ Total\ number\ of\ observations } \)
\(=\frac { 2+3+4+5+0+1+3+3+4+3 }{ 10 } \)
\(=\frac { 28 }{ 10 } =2.8\)
(ii) Median
Arranging the given data in ascending order, we have
0,1,2,3,3,3,3,4,4,5
Number of observations (n) = 10, which is even.
\(\therefore\) Median
\(= \frac {\left (\frac{n}{2}\right)^{th} observation + \left(\frac {n}{2}+1\right)^{th} observation}{2}\)
\(= \frac {\left (\frac{10}{2}\right)^{th} observation + \left(\frac {10}{2}+1\right)^{th} observation}{2}\)
\(\frac {{5}^{th} observation+{6}^{th}observation}{2}\)
\(\frac{3+3}{2}=\frac{6}{2}=3\)
(iii) Mode
Arranging the given data in ascending order, we have
0,1,2,3,3,3,3,4,4,5
Here, 3 occurs most frequently (4 times)
\(\therefore\) Mode = 3.
7.
Modified Table
[Minimum class-size = 1]
| Age (in years) | Number of children (frequency) | Width of the class | Length of the rectangle |
| 1-2 | 5 | 1 | \(\frac {5}{1}\times 1 = 5\) |
| 2-3 | 3 | 1 | \(\frac {3}{1}\times 1 = 3\) |
| 3-5 | 6 | 2 | \(\frac {6}{2}\times 1 = 3\) |
| Age (in years) | Number of children (frequency) | Width of the class | Length of the rectangle |
| 5-7 | 12 | 2 | \(\frac {12}{2}\times 1 = 6\) |
| 7-10 | 9 | 3 | \(\frac {9}{3}\times 1 = 3\) |
| 10-15 | 10 | 5 | \(\frac {10}{5}\times 1 = 2\) |
| 15-17 | 4 | 2 | \(\frac {4}{2}\times 1 = 2\) |
8.
(i)
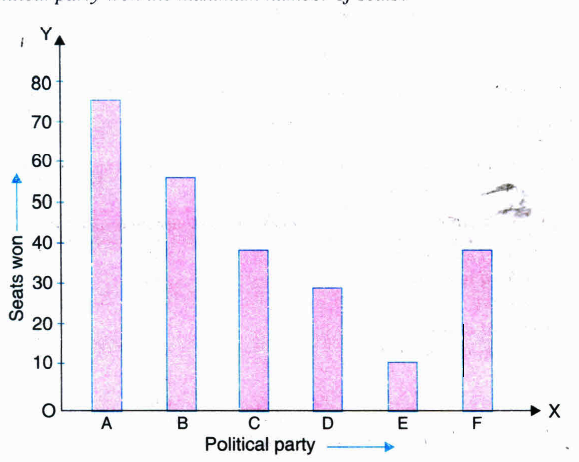
(ii) Political party A won the maximum number of seats.
9.
Frequency polygon is with class marks:
| Class Marks | Frequency |
|---|---|
| 155 | 5 |
| 165 | 15 |
| 175 | 20 |
| 185 | 25 |
| 195 | 15 |
| 205 | 5 |
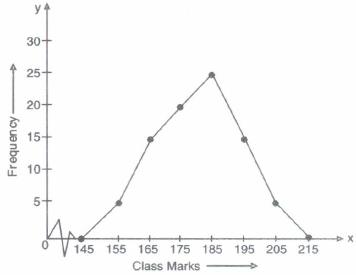
Frequency polygon showing various frequency for the class intervals given
10.
| Marks | No. of students |
|---|---|
| 0-20 | 15 |
| 20-40 | 10 |
| 40-60 | 10 |
| 60-80 | 11 |
| 80-100 | 4 |
Frequency polygon graph is ABCDEFG
11.
\(\therefore\) Mean of 200 items = 50
\(\therefore\) Sum of items \(= 200 \times 50 = 10000\)
Corrected sum = 10000 - (92 + 8) + (192 + 88)
= 10180
\(\therefore\) Correct mean \(= \frac {10180}{200}=50.9\)
12.
13.
14.
(c)
40
15.
Definition of a secondary data
16.
(a)
Useless data
17.
(a)
Mathematics
18.
(a)
Latin word
19.
()
140
20.
()
26
21.
()
Range = highest value-lowest value
= 45 - 20
= 25
22.
()
Range = highest point-lowest point
= 27 - 2 = 25
23.
()
Mode = 27
9th Standard CBSE Syllabus & Materials
9th Standard CBSE
CBSE 9th Mathematics Lines and Angles Sample Question Papers Study Material - QB365 Set A
NEW9th Standard CBSE
CBSE 9th Mathematics Introduction to Euclid's Geometry Sample Question Papers Study Material - QB365 Set A
NEW9th Standard CBSE
CBSE 9th Mathematics Linear Equations in Two Variables Sample Question Papers Study Material - QB365 Set A
NEW9th Standard CBSE
CBSE 9th Mathematics Coordinate Geometry Sample Question Papers Study Material - QB365 Set A


NCERT Books

Syllabus

Exam Pattern

Sample Question Papers

Previous year Question Papers

Important Notes

MCQ Practice test

NCERT Exemplers

Case study Questions

Image Based Questions

Passage based Questions

HOT Questions

Value Based Questions

Model Questions Papers
NCERT ( Book Back ) Questions

Assertion and Reason
Important Questions And Answers

CBSE 9th Standard CBSE Subjects
CBSE Standards