
 100% FREE ACCESS
9th Standard CBSE Syllabus & Materials
9th Standard CBSE
CBSE 9th Science Is matter around us pure? - New Model Questions Papers Study Material - QB365 Set A
NEW9th Standard CBSE
CBSE 9th Science Matter in our surroundings - New Model Questions Papers Study Material - QB365 Set A
NEW9th Standard CBSE
CBSE 9th Mathematics Heron's Formula Sample Question Papers Study Material - QB365 Set A
NEW9th Standard CBSE
CBSE 9th Mathematics Circles Sample Question Papers Study Material - QB365 Set A
NEW9th Standard CBSE
CBSE 9th Mathematics Quadrilaterals Sample Question Papers Study Material - QB365 Set A
NEW9th Standard CBSE
CBSE 9th Mathematics Triangles Sample Question Papers Study Material - QB365 Set A

Published on: 29/10/2025
Download CBSE Class 9th Standard CBSE Mathematics question papers, sample papers, important questions, and previous year solved papers in PDF format. Get free study materials, NCERT solutions, and exam preparation resources for Class 9th Standard CBSE Mathematics
Questions + Answers key
Take MCQ Mathematics Test
1.
From the following observations:
0.03,0.05,1.04,0.08,0.05,1.03,0.03,0.04,0.07,0.05, 0.02, 1.00, 0.08
(i) Calculate the Mode
(ii) Calculate the Range
2.
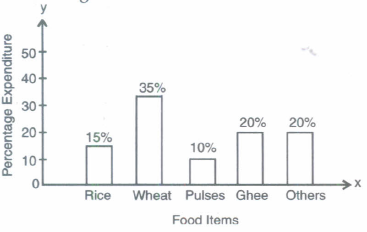
Read the bar graph. Find the percentage of excess expenditure on wheat than pulses and ghee taken together.
3.
Find the median of the squares of the first 8 natural numbers.
4.
If the mean of the following data is 15, find p:
|
x |
f |
|---|---|
| 5 | 6 |
| 10 | p |
| 15 | 6 |
| 20 | 10 |
| 25 | 5 |
5.
The mean of 10 numbers is 50. If one more number is ordered, then the mean is 50 itself. Find the added number.
6.
The mean of 100 observations is 60. If one observation of 50 is replaced by 110, then what will be the new mean?
7.
If the median of the data 12,24,30,35,37,40,3m,3m + 4,52,57,59,62,67,70 which is arranged in ascending order, is 47, find the value of m.
8.
10 numbers 8,11,15,19,x+1,2x-13,28,31,40,41 are written in ascending order. If the median is 24, find x.
9.
Find the median of the following data 15,28,72,56,44,32,31,43 and 51. If 32 is replaced by 23, find the new median.
10.
Consider the marks, out of 100, obtained by 51 students of a class in a test:
| Marks | Number of students |
|---|---|
| 0-10 | 5 |
| 10-20 | 10 |
| 20-30 | 4 |
| 30-40 | 6 |
| 40-50 | 7 |
| 50-60 | 3 |
| 60-70 | 2 |
| 70-80 | 2 |
| 80-90 | 3 |
| 90-100 | 9 |
| Total | 51 |
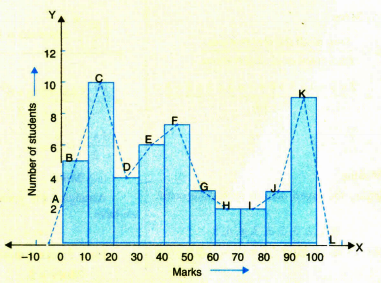
Draw a frequency polygon corresponding to this frequency distribution table.
11.
Prepare a frequency table from the data follows:
| Marks obtained | No. of students |
| More than or equal to 0 | 50 |
| More than or equal to 20 | 48 |
| More than or equal to 40 | 41 |
| More than or equal to 60 | 30 |
| More than or equal to 80 | 12 |
12.
The marks obtained by 40 students of class IX in an examination are given below:
12,8,18,8,6,16,12,5,
23,2,10,20,12,9,7,6,
5,3,5,13,21,13,15,20,
24,1,7,16,21,13,23,18,
7,3,18,17,16,16,23,12
Represent the data in the form of a freqency distribyuting using 15-20 (20 not included) as one of the class intervals.
13.
The marks obtained out of 75 by 30 students of a class in an examination are given below:
42,21,50,37,42,37,38,42,49,52,38,53,57,47,29,59,61,33,17,17,39,44,42,39,14,7,27,19,54,51
Prepare a frequency distribution table in which the size of class intervals is the same and one class intervalis 0-10.
1.
Arranging the data in ascending order
0.02, 0.03, 0.03, 0.04, 0.05, 0.05, 0.05, 0.07, 0.08, 0.08, 1.00, 1.03, 1.04
Mode = 0.05
Range = 1.04 - 0.02 = 1.02.
2.
Expenditure on pulses and ghee
= 10% + 20% = 30%
Expenditure on wheat = 35%
Excess expenditure on wheat = 35% - 30% = 5%
3.
Ascending order of terms 1,4,9,16,25,36,49,64
no. of terms = 8(even)
Median = Mean of 4th and 5th terms
=\(\frac{16+25}{2}=\frac{41}{2}\) = 20.5
4.
8
5.
50
6.
60.6
7.
15
8.
20
9.
43,43
10.
Let us first draw a histogram for this data and mark the mid-points of the tops of the rectangles as B, C, D, E, F, G, H, I, J, K, respectively. Here, the first class is 0-10. So, to find the class preceeding 0-10, we extend the horizontal axis in the negative direction and find the mid-point of the imaginary class-interval (–10) - 0. The first end point, i.e., B is joined to this mid-point with zero frequency on the negative direction of the horizontal axis. The point where this line segment meets the vertical axis is marked as A. Let L be the mid-point of the class succeeding the last class of the given data. Then OABCDEFGHIJKL is the frequency polygon, which is shown in Fig.
11.
| 0-20 | 2 |
| 20-40 | 7 |
| 40-60 | 11 |
| 60-80 | 18 |
| 80 & Above | 12 |
12.
| 0-5 | 4 |
| 5-10 | 11 |
| 10-15 | 8 |
| 15-20 | 9 |
| 20-25 | 8 |
13.
| Class | Frequency |
| 0-10 | 1 |
| 10-20 | 4 |
| 20-30 | 3 |
| 30-40 | 7 |
| 40-50 | 7 |
| 50-60 | 7 |
| 60-70 | 1 |
| Total | 30 |

9th Standard CBSE Syllabus & Materials
9th Standard CBSE
CBSE 9th Mathematics Lines and Angles Sample Question Papers Study Material - QB365 Set A
NEW9th Standard CBSE
CBSE 9th Mathematics Introduction to Euclid's Geometry Sample Question Papers Study Material - QB365 Set A
NEW9th Standard CBSE
CBSE 9th Mathematics Linear Equations in Two Variables Sample Question Papers Study Material - QB365 Set A
NEW9th Standard CBSE
CBSE 9th Mathematics Coordinate Geometry Sample Question Papers Study Material - QB365 Set A



NCERT Books

Syllabus

Exam Pattern

Sample Question Papers

Previous year Question Papers

Important Notes

MCQ Practice test

NCERT Exemplers

Case study Questions

Image Based Questions

Passage based Questions

HOT Questions

Value Based Questions

Model Questions Papers
NCERT ( Book Back ) Questions

Assertion and Reason
Important Questions And Answers

CBSE 9th Standard CBSE Subjects
CBSE Standards