 100% FREE ACCESS
9th Standard CBSE Syllabus & Materials
9th Standard CBSE
CBSE 9th Science Is matter around us pure? - New Model Questions Papers Study Material - QB365 Set A
NEW9th Standard CBSE
CBSE 9th Science Matter in our surroundings - New Model Questions Papers Study Material - QB365 Set A
NEW9th Standard CBSE
CBSE 9th Mathematics Heron's Formula Sample Question Papers Study Material - QB365 Set A
NEW9th Standard CBSE
CBSE 9th Mathematics Circles Sample Question Papers Study Material - QB365 Set A
NEW9th Standard CBSE
CBSE 9th Mathematics Quadrilaterals Sample Question Papers Study Material - QB365 Set A
NEW9th Standard CBSE
CBSE 9th Mathematics Triangles Sample Question Papers Study Material - QB365 Set A

Published on: 29/10/2025
Download CBSE Class 9th Standard CBSE Mathematics question papers, sample papers, important questions, and previous year solved papers in PDF format. Get free study materials, NCERT solutions, and exam preparation resources for Class 9th Standard CBSE Mathematics
Questions + Answers key
Take MCQ Mathematics Test
1.
10 numbers 8,11,15,19,x+1,2x-13,28,31,40,41 are written in ascending order. If the median is 24, find x.
2.
Find the median of the following data 15,28,72,56,44,32,31,43 and 51. If 32 is replaced by 23, find the new median.
3.
The blood group of 30 students are recorded as follows:
| A, | B, | O, | A, | AB, | O, |
| A | O, | B, | A, | O, | B, |
| A | AB, | B, | A, | AB, | B, |
| A, | A, | O, | A, | AB, | B, |
| A, | O, | B, | A, | B, | A |
Prepare a freqeuncy distribution table for the data.
4.
In a specific year, the distribution of the ages (in years) of primary teachers of a district is given:
| Age (in years) | Number of teachers |
| 15-20 | 10 |
| 20-25 | 30 |
| 25-30 | 50 |
| 30-35 | 50 |
| 35-40 | 30 |
| 40-45 | 6 |
| 45-50 | 4 |
(i) What is the lower limit of the first class interval?
(ii) What are the limits of the fourth class interval?
(iii) What is the class mark of the class 45-50?
5.
Find the mode of 14,25,14,28,18,17,18,14,23,22,14,18
6.
In a Mathematics test given to 15 students, the following marks (out of 100) are recorded:
41,39,48,52,46,62,54,40,96, 52,98,40,42,52,60
Find the mean, median and mode of this data.
7.
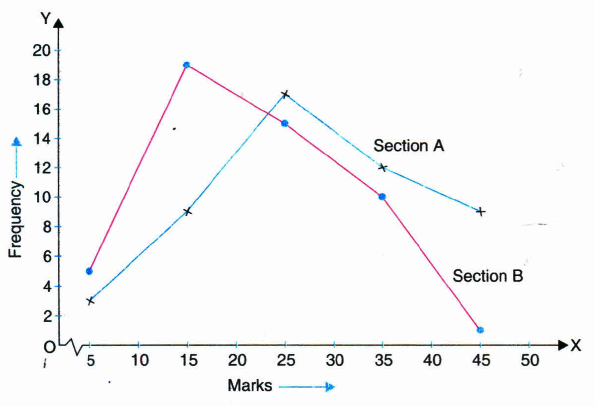
The following table gives the distribution of students of two sections according to the marks obtained by them:
| Section A Section B | |||
| Marks | Freqeuncy | Marks | Freqency |
| 0-10 | 3 | 0-10 | 5 |
| 20-20 | 9 | 10-20 | 19 |
| 20-30 | 17 | 20-30 | 15 |
| 30-40 | 12 | 30-40 | 10 |
| 40-50 | 9 | 40-50 | 1 |
Represent the marks of the students of both the sections on the same graph by two frequency polygons. From the two polygons compare the performance of the two sections.
8.
The length of 40 leaves of a plant are measured a correct one millimeter, and the obtained data is represented in the following table:
| Length (in mm) | Number of leaves |
| 118-126 | 3 |
| 127-135 | 5 |
| 136-144 | 9 |
| 145-153 | 12 |
| 154-162 | 5 |
| 163-171 | 4 |
| 172-180 | 2 |
(i) Draw a histogram to represent the given data.
(ii) Is there any suitable graphical representation for the same data?
(iii) Is it correct to conclude that the maximum number of leaves are 153 mm long? Why?
9.
The following data on the number of girls (to the nearest ten) per thousand boys in different sections of the Indian society is given below:
| Section | Number of girls per thousand boys |
| Scheduled Caste (SC) | 940 |
| Scheduled Tribe (ST) | 970 |
| Non SC/ST | 920 |
| Backward districts | 950 |
| Non-backward districts | 920 |
| Rural | 930 |
| Urban | 910 |
(i) Represent the information above by a bar graph.
(ii) In the classroom discuss what conclusion can be arrived at from the graph.
10.
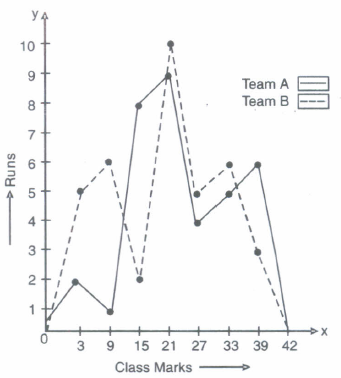
The runs scored by two teams A and B on the first 42 balls in a cricket match are given below. Draw the frequency polygon on the same graph paper.
| Number of balls | Team A | Team B |
|---|---|---|
| 0-6 | 2 | 5 |
| 6-12 | 1 | 6 |
| 12-18 | 8 | 2 |
| 18-24 | 9 | 10 |
| 24-30 | 4 | 5 |
| 30-36 | 5 | 6 |
| 36-42 | 6 | 3 |
11.
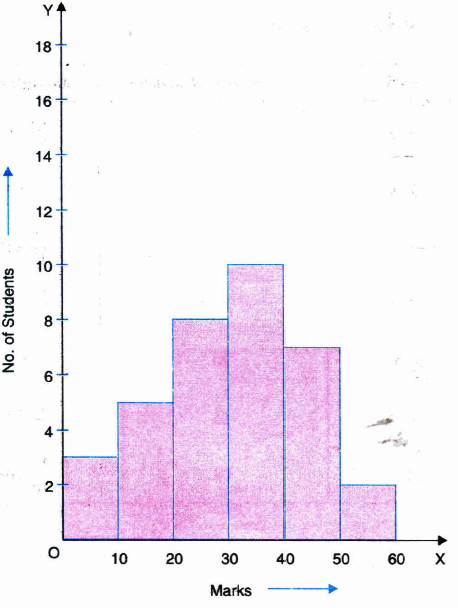
Draw a histogram representing the following frequency distribution:
| Marks | No. of students |
| 0-10 | 3 |
| 10-20 | 5 |
| 20-30 | 8 |
| 30-40 | 10 |
| 40-50 | 7 |
| 50-60 | 2 |
12.
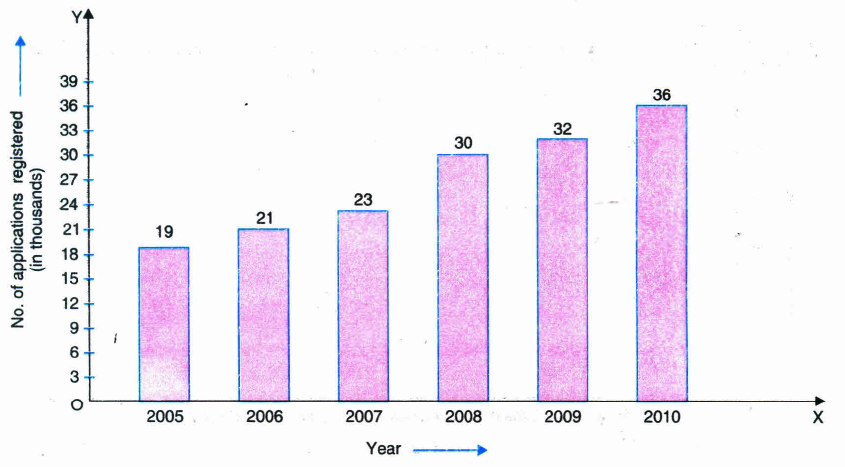
The following data gives the number (in thousands) of applicants registered with an Employment Exchange during 2005-2010.
| Year | No.of applications registered (in thousands) |
| 2005 | 19 |
| 2006 | 21 |
| 2007 | 23 |
| 2008 | 30 |
| 2009 | 32 |
| 2010 | 36 |
Construct a bar graph to represent the above data.
13.
The width of the class interval 70.5 - 75.5 is
5
2.5
0.5
10.
14.
In the distribution, the frequency of the class 0 - 5 is
0,3,2,5,8,10,13,5,6,6,14,0.
1
2
3
4
15.
Class mark =
\(\frac {lower \ limit + upper \ limit}{2}\)
lower limit + upper limit
upper limit - lower limit
\(\frac {lower \ limit - upper \ limit}{2}\)
16.
When the information is gathered from a source which already had the information stored, the data obtained is called
Primary data
Secondary data
Useless data
fictitious data
17.
Statistics is branch of
Mathematics
Physics
Chemistry
Psychology
18.
The % of marks obtained by students in the annual examination of a class in mathematics are given below:
| Percentage of marks | No. of students |
|---|---|
| 0-10 | 8 |
| 10-30 | 32 |
| 30-45 | 18 |
| 45-50 | 10 |
(i) How many students get less than 30% of marks?
(ii) Represent the data by histogram.
(iii) Which value is depicted by a student Ram obtaining the highest marks in the interval 45-50?
19.
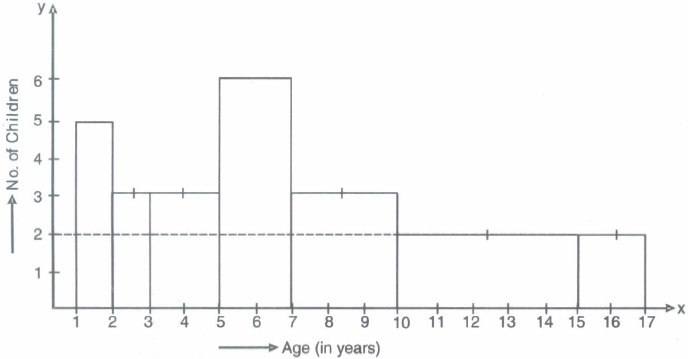
Survey on the playing children of various age group is:
| Age(in yrs) | No. of Children |
| 1-2 | 5 |
| 2-3 | 3 |
| 3-5 | 6 |
| 5-7 | 12 |
| 7-10 | 9 |
| 10-15 | 10 |
| 15-17 | 4 |
Draw the histogram of above data
1.
20
2.
43,43
3.
| O | 6 |
| A | 12 |
| B | 8 |
| AB | 4 |
4.
(i) 15
(ii) 30-35
(iii) 47.5
5.
The given data is
14,25,14,28,18,17,18,14,23,22,14,18
Arranging the data in ascending order, we have
14,14,14,14,17,18,18,18,22,23,25,28
Here, 14 occurs most frequently (4 times)
\(\therefore\) Mode = 14.
6.
(i) Mean
\(Mean = \frac { Sum\ of\ all\ the\ observations }{ Total\ number\ of\ observations } \)
\(=\frac {41+39+48+52+46+62+54+40+96+52+98+40+42+52+60}{15}\)
\(=\frac {822}{15}=54.8\)
(ii) Median
Arranging the given data in descending order, we have
98,96,62,54,52,52,48,46,42,41,40,40,39
Number of observations (n) = 15, which is odd.
\(\therefore\) Median \(=\left(\frac{n+1}{2}\right)^{th}{2}\) observation.
\(={ \left( \frac {15+1 }{ 2 } \right) }^{ th }\) observation
= 8th observation = 52
(iii) Mode
Arranging the data in descending order, we have
98,96,62,60,54,52,52,52,48,46,42,41,40,39
Here, 52 occurs most frequently (3 times)
\(\therefore\) Mode = 52.
7.
Modified Tables
For Section A
| Marks | Class Marks | Freqeuncy |
| 0-10 | 5 | 3 |
| 10-20 | 15 | 9 |
| 20-30 | 25 | 17 |
| 30-40 | 35 | 12 |
| 40-50 | 45 | 9 |
For Section B
| Marks | Class Marks | Freqeuncy |
| 0-10 | 5 | 5 |
| 10-20 | 15 | 19 |
| 20-30 | 25 | 15 |
| 30-40 | 35 | 10 |
| 40-50 | 45 | 1 |
8.
Modified Continues Distribution
| Length (in mm) | Number of leaves |
| 117.5-126.5 | 3 |
| 126.5-135.5 | 5 |
| 135.5-144.5 | 9 |
| 144.5-153.5 | 12 |
| 153.5-162.5 | 5 |
| 162.5-171.5 | 4 |
| 171.5-180.5 | 2 |
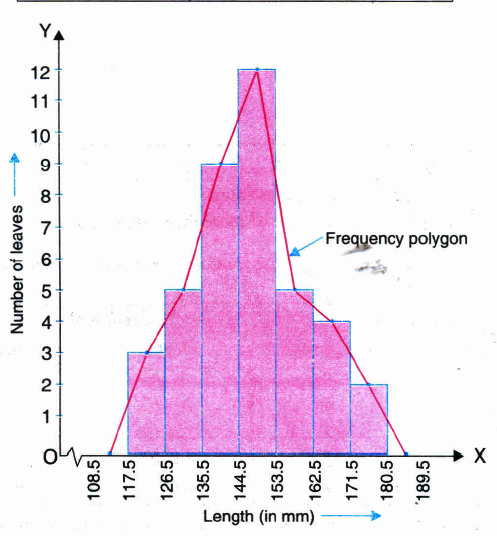
(ii) Frequency Polygon.
(iii) No, because the maximum number of leaves have their lengths lying in the original interval 145-153 (or modified interval 144.5-153.5).
9.
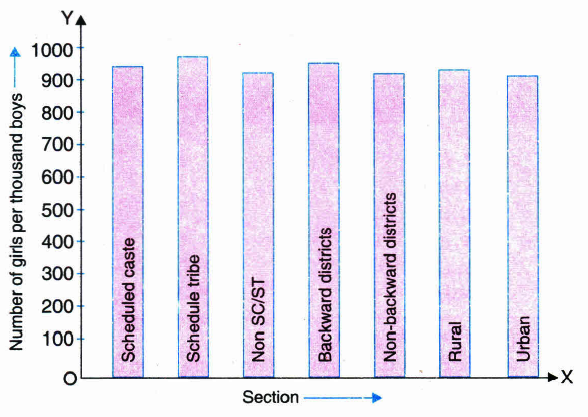
(ii) The two conclusions we can arrive at from the graph are as follows:
(a) The numbers of girls to the nearest ten per thousand boys is maximum in Scheduled Tribe section of the society and minimum in Urban section of the society.
(b) The number of girls to the nearest ten per thousand boys is the same for 'Non Sc/ST' and 'Non-backward Districts' sections of the society.
10.
11.
12.
13.
Width = 75.5 - 70.5 = 5.
14.
The item values included in 0 - 5 are 0,3,2,0.
15.
Formula
16.
Definition of a secondary data
17.
(a)
Mathematics
18.
(i) Required number of students = 8 + 32 = 40
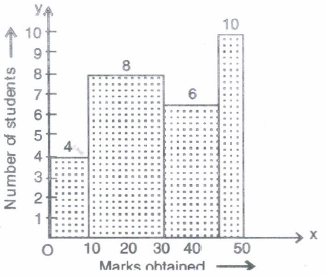
(ii) Here, We notice that classes are continuous but class-size is not the same for all the classes. We notice minimum class-size is of class 45-50, i.e., 5. We will first find proportionate length of rectangle (adjusted frequency) for each class.
Length of rectangle (adjusted frequency) =\(\frac { Frequency\ of\ Class }{ Width\ of\ class } \times Minimum\ class-size\)
| Marks (C.I.) |
Number of students(f) | Width of class (Clss-size) |
Length of rectangle |
|---|---|---|---|
| 0-10 | 8 | 10 | \(\frac{8}{10}\)x 5 = 4 |
| 10-30 | 32 | 20 | \(\frac{32}{20}\) x 5 = 8 |
| 30-45 | 18 | 15 | \(\frac{18}{15}\) x 5 = 6 |
| 45-50 | 10 | 5 | \(\frac{10}{5}\) x 5 = 10 |
Now, we construct rectangles with respective class-intervals as widths and adjusted frequencies as heights.
Histogram representing marks obtained by students in unit test of Mathematics.
(iii) Hardwork and Dilligence.
19.
| Age(in years) | No. of children | Width of class | Length of rectangle |
|---|---|---|---|
| 1-2 | 5 | 1 | \(\frac{5}{1}\)x1=5 |
| 2-3 | 3 | 1 | \(\frac{3}{1}\)x1=3 |
| 3-5 | 6 | 2 | \(\frac{6}{2}\)x1=3 |
| 5-7 | 12 | 2 | \(\frac{12}{2}\)x1=6 |
| 7-10 | 9 | 3 | \(\frac{9}{3}\)x1=3 |
| 10-15 | 10 | 5 | \(\frac{10}{5}\)x1=2 |
| 15-17 | 4 | 2 | \(\frac{4}{2}\)x1=2 |
Required histogram is as follows:

9th Standard CBSE Syllabus & Materials
9th Standard CBSE
CBSE 9th Mathematics Lines and Angles Sample Question Papers Study Material - QB365 Set A
NEW9th Standard CBSE
CBSE 9th Mathematics Introduction to Euclid's Geometry Sample Question Papers Study Material - QB365 Set A
NEW9th Standard CBSE
CBSE 9th Mathematics Linear Equations in Two Variables Sample Question Papers Study Material - QB365 Set A
NEW9th Standard CBSE
CBSE 9th Mathematics Coordinate Geometry Sample Question Papers Study Material - QB365 Set A



NCERT Books

Syllabus

Exam Pattern

Sample Question Papers

Previous year Question Papers

Important Notes

MCQ Practice test

NCERT Exemplers

Case study Questions

Image Based Questions

Passage based Questions

HOT Questions

Value Based Questions

Model Questions Papers
NCERT ( Book Back ) Questions

Assertion and Reason
Important Questions And Answers

CBSE 9th Standard CBSE Subjects
CBSE Standards