Class 11th Applied Mathematics - Descriptive Statistics Case Study Questions and Answers 2022 - 2023
By QB365 on 09 Sep, 2022
QB365 provides a detailed and simple solution for every Possible Case Study Questions in Class 11 Applied Mathematics Subject - Descriptive Statistics, CBSE. It will help Students to get more practice questions, Students can Practice these question papers in addition to score best marks.
QB365 - Question Bank Software
Descriptive Statistics Case Study Questions With Answer Key
11th Standard CBSE
-
Reg.No. :
Applied Mathematics
-
Covid 19 situation, data of various countries are given as shown in the pie chart which shows total population in countries which is infected due to corona virus. 21% is shown separately in different small circle.
On the basis of this information answer the questions as mentioned below:
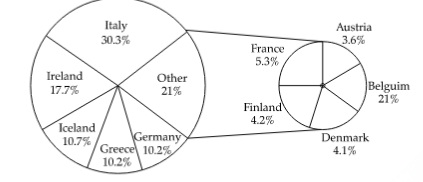
(i) If total population of Italy is 1,50,00,000, then how many person are infected due to corona.(a) 45,50,000 (b) 55,45,000 (c) 52,45,000 (d) 45,45,000 (ii) What is the central angle formed by the region represented by Italy i.e. , 30.3%
(a) 105.08° (b) 103.08° (c) 112.08° (d) 109.08° (iii) What is the total population in Germany is 5,54,40,000, then how many persons are infected by Corona Virus ?
(a) 56,54,880 (b) 66,54,880 (c) 57,54,880 (d) 59,54,880 (iv) What is the central angle formed by the region represented by Germany i.e., 10.2%
(a) 38° (b) 35° (c) 37° (d) 36° (v) If other region is having total population 1,50,00,000, then what is the population infected in Finland ?
(a) 5,50,000 (b) 4,35,000 (c) 6,30,000 (d) 5,30,000 (a) -
Production of fruits and vegetables are given in the form of the bar graph during a specific year.
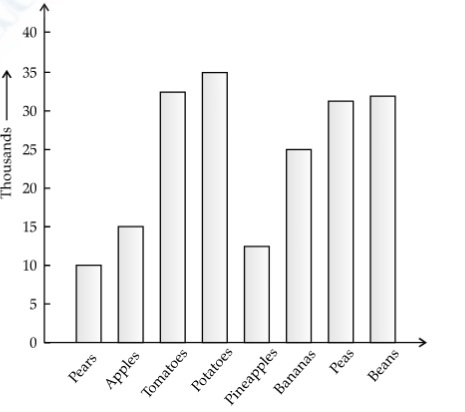
On the basis of this graph, answer the following questions
(i) Which fruit or vegetable production is highest as per the graph ?(a) Tomatoes (b) Potatoes (c) Peas (d) Bananas (ii) What is the difference between the highest production item and the lowest production item ?
(a) 20000 (b) 18000 (c) 15000 (d) 25000 (iii) Ratio of production of Bananas and Potatoes is
(a) 7 : 5 (b) 5 : 7 (c) 3 : 5 (d) 5 : 3 (iv) If production of Pineapple and apples are equal and the sum of their production is equal to thrice the production of Pears, then which of the following equation represent this:
(a) 2x = 3y (b) 2x = 5y (c) 2x = y (d) 3x = 2y (v) Which two items have same production during the year?
(a) Peas and Beans (b) Tomatoes and Potatoes (c) Peals and Pineapple (d) Apples and Bananas (a) -
Data of all the previous cricket matches are stored to analyze the average batting score of various batsmen. The scores of a batsman in ten innings are: 38, 70, 48, 34, 42, 55, 63, 46, 54, 44.
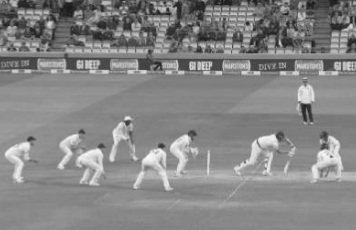
On the basis of above information answer the following questions.
(i) The median of the data is(a) 48 (b) 46 (c) 47 (d) 51 (ii) Mean of the given data is
(a) 51.2 (b) 49.4 (c) 46.5 (d) 43.5 (iii) What is the mean deviation about the median of the given scores ?
(a) 7.6 (b) 8.6 (c) 9.2 (d) 6.9 (iv) If the scores 38 and 34 are replaced by 68 and 74 what will be the mean of the data ?
(a) 52.8 (b) 45.8 (c) 58.2 (d) 56.4 (v) Difference between maximum value of data and minimum vale of data is called
(a) average (b) mean (c) mode (d) range (a) -
The marks scored by five students in a test for 25 marks are: 8, 13, 12, 15, 22.

On the basis of this information answer the following questions
(i) Mean of the data is(a) 14 (b) 19 (c) 20 (d) 15 (ii) What is the variance of the given data ?
(a) 19.8 (b) 20.4 (c) 21.2 (d) 18.8 (iii) Relation between Variance and Standard Deviation is
(a) \(\text { Variance }=\frac{1}{2} \sqrt{S . D}\) (b) \(\text { Variance }=\sqrt{S . D}\) (c) \(\text { Variance }=3 \sqrt{S . D}\) (d) \(\text { Variance }=\frac{1}{4} \sqrt{S . D}\) (iv) What is the Standard Deviation of the data ?
(a) 4.604 (b) 5.2 (c) 4.3 (d) 3.604 (v) Mean of first 20 natural numbers is
(a) 14.5 (b) 11 (c) 10.5 (d) 12.5 (a) -
In XI standard, teacher was discussing about Spearman’s Rank Correlation Coefficient in Statistics. Following points were discussed in the class about the same topic:
When we are finding correlation between two qualitative characteristics, say, beauty and intelligence, we take recourse to using rank correlation coefficient. Rank correlation can also be applied to find the level of agreement (or disagreement) between two judges so far as assessing a qualitative characteristic is concerned. As compared to product moment correlation coefficient, rank correlation is easier to compute, it can also be advocated to get a first hand impression about the correlation between a pair of variables. Spearman's rank correlation coefficient is given by
\(r_{\mathrm{S}}=1-\frac{6 \Sigma d^{2}}{n\left(n^{2}-1\right)}\)
where,d = difference between ranks of corresponding x and y n = number of pairs of values (x,y) in the data
1. When the rank are repeated, the Spearman's rank correlation coefficient formula is given by
\(r_{\mathrm{S}}=1-\frac{6\left[\Sigma d^{2}+\frac{\left(m_{1}^{3}-m_{1}\right)}{12}+\frac{\left(m_{2}{ }^{3}-m_{2}\right)}{12}+\ldots . .\right]}{n\left(n^{2}-1\right)}\)
where, m1, m2, ....., are the number of repetitions of ranks and \(\frac{m_{1}^{3}-m_{1}}{12}\) ...... their corresponding correlation factors.
For example :
Ranks obtained by 10 students are given below:3 4 7 8 9 7 3 4 1 1 (i) The value \(\Sigma d\) is
(a) 0 (b) 1 (c) -1 (d) 2 (ii) What is the value \(\Sigma d^{2}\) is
(a) 165 (b) 172 (c) 166 (d) 169 (iii) What is the value of n2 in the given data?
(a) 64 (b) 81 (c) 90 (d) 100 (iv) What is rank correlation of the given data?
(a) 0.005 (b) 0.006 (c) –0.06 (d) –0.006 (v) What does very low value of the rank correlation in the above answer indicates?
(a) there is very strong agreement between the ranks (b) there is hardly any agreement between the ranks (c) can’t say (d) None of these (a) -
In class of Statistics, teacher was discussing the concept of Measures of Correlation, in which he was discussing about Karl Pearson’s Coefficient of Correlation. During his class, he discussed the following few points on this:
This is the best method for finding correlation between two variables provided the relationship between the two variables is linear. This method is also known as product-moment correlation coefficient. Pearson's correlation coefficient may be defined as the ratio of covariance between the two variables to the product of the standard deviations of the two variables.
If the two variables are denoted by x and y and of the corresponding bivariates data are ( x i , y i) for i = 1, 2, 3, ...., n, then the coefficent of correlation between x and y due to Karl Pearson, is given by:
r = rxy
\(\text { or } \quad r_{x y}=\frac{\operatorname{Cov}(x, y)}{\sqrt{\operatorname{Var} x} \cdot \sqrt{\operatorname{Var} y}}\)
= \(\frac{\operatorname{Cov}(x, y)}{\sigma_{x} \cdot \sigma_{y}}\)
where,
\(\operatorname{Cov}(x, y)=\frac{\Sigma(x-\bar{x})(y-\bar{y})}{N}\)
= \(\frac{\Sigma x y}{N}-\bar{x} \cdot \bar{y}\)
= \(\sigma_{x}=\sqrt{\frac{\Sigma(x-\bar{x})^{2}}{N}}=\sqrt{\frac{\Sigma x^{2}}{N}-x^{-2}}\)
= \(\sigma_{y}=\sqrt{\frac{\Sigma(y-\bar{y})^{2}}{N}}=\sqrt{\frac{\Sigma y^{2}}{N}-y^{-2}}\)
\(\text { If } x-\bar{x}, y-\bar{y}\) are small fractions, we use \(r=\frac{\Sigma(x-\bar{x})(y-\bar{y})}{\sqrt{\sum(x-\bar{x})^{2}} \sqrt{\Sigma(y-\bar{y})^{2}}}\)If x, y are small numbers, we use \(r=\frac{\Sigma x y-\frac{1}{N} \Sigma x \Sigma y}{\sqrt{\Sigma x^{2}-\frac{1}{N}(\Sigma x)^{2}} \sqrt{\sum y^{2}-\frac{1}{N}(\Sigma y)^{2}}}\)
For example:
Find Karl Pearson's coefficient of correlation between X and Y for the following :x 5 4 3 2 1 y 4 2 10 8 6 Following problem was given to students on the same concept:
On the basis of the above information, answer the following questions:
(i) Pearson’s correlation coefficient may be defined as the ratio of covariance between the two variables to the(a) product of mean deviations (b) product of the standard deviations (c) product of negative correlation (d) product of positive correlation (ii) What is the value \(\Sigma x y\) in this data:
(a) 65 (b) 70 (c) 80 (d) 90 (iii) What is the value \(\Sigma x^{2}\)?
(a) 40 (b) 35 (c) 50 (d) 45 (iv) What is the value of \(\Sigma y^{2}\) ?
(a) 220 (b) 230 (c) 195 (d) 210 (v) What is the value of Karl Pearson’s Coefficient of Correlation between x and y?
(a) 0.2 (b) -0.5 (c) -0.2 (d) 0.5 (a)
Case Study
*****************************************
Answers
Descriptive Statistics Case Study Questions With Answer Key Answer Keys
-
(i) (d): 45,45,000
Total population infected with Corona Virus
\(=\frac{30.3}{100} \times 1,50,00,000\)
= 45,45,000
(ii) (d): 109.08°
Central angle = \(\frac{30.3}{100} \times 360^{\circ}\)
= 109.08°
(iii) (a): 56,54,880
Total population infected
\(=\frac{10.2}{100} \times 55440000\)
= 56,54,880
(iv) (c) : 37°
Central angle \(=\frac{10.2}{100} \times 360^{\circ}=36.7\)
= 37°
(v) (c): 6,30,000
Total population infected in Finland
\(=\frac{4.2}{100} \times 1,50,00,000\)
= 6,30,000 -
(i) (b): potatoes
Highest production item is potatoes i.e., 35,000
(ii) (d): 25000
Difference = 35000 – 10000
= 25000
(iii) (b): 5 : 7
\( \text { Ratio } =\frac{25000}{35000} \)
\(=\frac{5}{7} \)
= 5 : 7
(iv) (a): 2x = 3y
Since production Pineapple and Apples are equal, let it be x and let production of Pears is y.
Therefore,2x = 3y
(v) (a): Peas and Beans -
(i) (c): 47
Arranging the data in ascending order
= 34, 38, 42, 44, 46, 48, 54, 55, 63, 70
Median = A.M. of 5th and 6th observation
\(=\frac{46+48}{2}=47\)
(ii) (b): 49.4
Sum of all the scores = 494
\(\text { Mean }=\frac{494}{10}=49.4\)
(iii) (b): 8.6xi \(\left|d_{i}\right|=\left|x_{i}-47\right|\) 38 9 70 23 48 1 34 13 42 5 55 8 63 16 46 1 54 7 44 3 Total \(\sum\left|d_{i}\right|=86\) \(\text { Mean Deviation }=\frac{1}{n} \times \sum\left|d_{i}\right|=\frac{86}{10}=8.6\)
(iv) (d): 56.4
Sum of new scores = 564
New mean = \(\frac{564}{10}=56.4\)
(v) (d): range
It is called range of the data. -
(i) (a): 14
\(\text { Mean }=\frac{12+8+13+15+22}{5}\)
= 14
(ii) (c): 21.1
Since, mean \((\bar{x})\) = 14xi xi - \((\bar{x})\) (xi - \((\bar{x})\))2 8 -6 36 12 -2 4 13 -1 1 15 1 1 22 8 64 \( \operatorname{Var}(X) =\frac{1}{n} \sum\left(x_{i}-\bar{X}\right) \)
\(=\frac{106}{5}=21.2\)
(iii) (b): \(\text { Variance }=\sqrt{S . D}\)
(iv) (a): 4.604
\( \mathrm{S} . \mathrm{D} =\sqrt{\mathrm{Var}} \)
\(=\sqrt{21.2}=4.604 \)
(v) (c): 10.5
Sum of first 20 natural numbers = S20
\(=\frac{20}{2}[2 \times 1+(19) 1]\)
s20 = 210
\(\text { Mean }=\frac{210}{20}\)
= 10.5 -
(i) (a): 0
Rank in Maths(Rx) Rank in Physics(Ry) d = Rx - Ry 10 5 5 5 6 -1 6 9 -3 1 2 -1 2 8 -6 3 7 -4 4 3 1 7 4 3 8 1 -2 9 1 8 - - 0 Therefore, \(\Sigma d\) = 0
(ii) (c): 166
\(\Sigma d^{2}\) = 25 + 1 + 9 + 1 + 36 + 16 + 1 + 9 + 4 + 64
= 166
(iii) (d): 100
n2 = 102
= 100
(iii) (d): –0.006
Rank correlation is given by:
\(r_{s}=1-\frac{6 \Sigma d^{2}}{n\left(n^{2}-1\right)}\)
= \(1-\frac{6 \times 166}{10\left(10^{2}-1\right)}\)
= \(1-\frac{996}{990}\)
= \(\frac{990-996}{990}\)
= \(\frac{-6}{990}\)
= –0.006
(v) (b): there is hardly any agreement between the ranks.
The very low value (almost 0) indicates that there is hardly any agreement between the ranks. -
(i) (b): product of the standard deviations
(ii) (c): 80x y xy 5 4 20 4 2 8 3 10 3 2 8 16 1 6 6 Total 80 (iii) (c): 55
x x2 5 25 4 16 3 9 2 4 1 1 \(\Sigma x^{2}\) 55 (iv) (a): 220
y y2 4 16 2 4 10 100 8 64 6 36 \(\Sigma y^{2}\) 220 (v) (b): –0.5
\(\frac{\Sigma x y-\frac{1}{N} \Sigma x \Sigma y}{\sqrt{\Sigma x^{2}-\frac{(\Sigma x)^{2}}{N}} \sqrt{\Sigma y^{2}-\frac{(\Sigma y)^{2}}{N}}}\)x x2 y y2 xy 5 25 4 16 20 4 16 5 4 8 3 9 10 100 30 2 4 8 64 16 1 1 6 36 6 \(\Sigma x=15\) \(\Sigma x^{2} \stackrel{r}{=}=\overline{55}\) \(\Sigma y=30\) \(\Sigma y^{2}=220\) \(\sum x y=80\)
= \(\frac{80-\frac{1}{5} \times 15 \times 30}{\sqrt{55-\frac{(15)^{2}}{5}} \sqrt{220-\frac{(30)^{2}}{5}}}\)
= \(\frac{-10}{\sqrt{10} \sqrt{40}}=\frac{-10}{20}=-0.5\)
Therefore, Karl Pearson’s Coefficient of Correlation between x and y is –0.5.
Case Study

