
 100% FREE ACCESS
12th Standard Syllabus & Materials
12th Standard
TN 12th Computer Applications மின்னணு தரவு பரிமாற்றம் Sample Question Papers Study Material - QB365 Set A
NEW12th Standard
TN 12th Computer Applications மின் - வணிக பாதுகாப்பு அமைப்புகள் Sample Question Papers Study Material - QB365 Set A
NEW12th Standard
TN 12th Computer Applications மின்னணு செலுத்தல் முறைகள் Sample Question Papers Study Material - QB365 Set A
NEW12th Standard
TN 12th Computer Applications மின் - வணிகம் Sample Question Papers Study Material - QB365 Set A
NEW12th Standard
TN 12th Computer Applications திறந்த மூல கருத்துருக்கள் Sample Question Papers Study Material - QB365 Set A
NEW12th Standard
TN 12th Computer Applications வலையமைப்பு வடமிடல் Sample Question Papers Study Material - QB365 Set A

Published on: 22/08/2026
Download Tamil Nadu 12th Standard Economics question papers, model tests, one-mark questions, important questions, and public exam papers in PDF format. Free study materials and answer keys for TN State Board students.
Questions + Answers key
Take MCQ Economics Test
1.
The term Uiis introduced for the representation of
Omitted Variable
Standard error
Bias
Discrete Variable
2.
The raw materials of Econometrics are:
Data
Goods
Statistics
Mathematics
3.
Econometrics is the integration of
Economics and Statistics
Economics and Mathematics
Economics, Mathematics and Statistics
None of the above
4.
In the regression equation \(Y={ \beta }_{ \alpha }+{ \beta }_{ 1 }{ X }_{ , }\)the Y is called:
Independent variable
Dependent variable
Continuous variable
None of the above
5.
A process by which we estimate the value of dependent variable on the basis of one or more independent variables is called
Correlation
Regression
Residual
Slope
6.
The term regression was used by:
Newton
Pearson
Spearman
Galton
7.
If the points on the scatter diagram indicate that as one variable increases the other variable tends to decrease the value of r will be:
Perfect positive
Perfect negative
Negative
Zero
8.
A measure of the strength of the linear relationship that exists between two variables is called:
Slope
Intercept
Correlation coefficient
Regression equation
9.
Sources of secondary data are______
Published sources
Unpublished sources
Neither published nor unpublished sources
Both (a) and (b)
10.
The word 'statistics' is used as _______
Singular.
Plural
Singular and Plural.
None of above
11.
12.
Perspective plan is also known as______
Short-term plan
Medium-term plan
Long-term plan
None of the above
13.
Planning Commission was set up in the year ________
1950
1951
1947
1948
14.
The basic philosophy behind long-term planning is to bring _______changes in the economy?
Financial
Agricultural
Industrial
Structural
15.
Short-term plan is also known as________
Controlling Plans
De-controlling Plans
Rolling Plans
De-rolling Plans
16.
M.N. Roy was associated with_______
Congress Plan
People's Plan
Bombay Plan
None of the above
17.
18.
Economic growth measures the_______
Growth of productivity
Increase in nominal income
Increase in output
None of the above
19.
Which among the following is a characteristic of underdevelopment?
Vicious circle of poverty
Rising mass consumption
Growth of Industries
High rate of urbanization
20.
"Redistribution with Growth" became popular slogan under which approach?
Traditional approach
New welfare oriented approach
Industrial approach
None of the above
21.
What is Econometrics?
22.
23.
Define Correlation.
24.
What are the kinds of data?
25.
What are the kinds of Statistics?
26.
Write a short note on NITI Aayog
27.
What are the social indicators of economic development?
28.
What is GNP?
29.
Mention the indicators of development.
30.
Define economic development
31.
Discuss the important statistical organizations (offices) in India.
32.
Differentiate the economic model with econometric model.
33.
Mention the uses of Regression Analysis.
34.
35.
What are the functions of Statistics?
36.
What are the functions of NITI Aayog?
37.
Describe the case for planning
38.
Trace the evolution of economic planning in India.
39.
What are the non-economic factors determining development?
40.
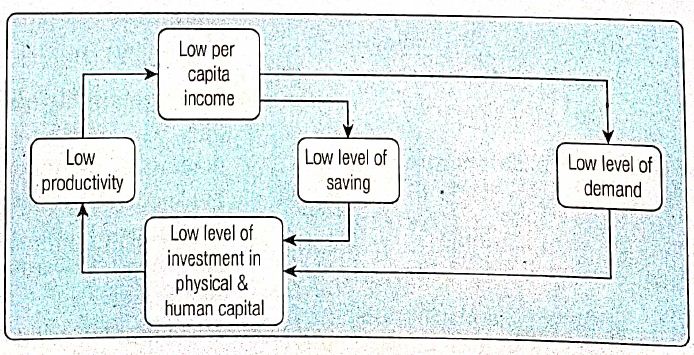
Elucidate major causes of vicious circle of poverty with diagram
41.
Describe the application of Econometrics in Economics.
42.
Find the regression equation Y on X and X on Y for the following data:
| Y | 45 | 48 | 50 | 55 | 65 | 70 | 75 | 72 | 80 | 85 |
| X | 25 | 30 | 35 | 30 | 40 | 50 | 45 | 55 | 60 | 65 |
43.
44.
Elucidatethe nature and scope of Statistics.
45.
Bring out the arguments against planning.
46.
47.
Discuss the economic determinants of economic development.
1.
(a)
Omitted Variable
2.
(a)
Data
3.
(c)
Economics, Mathematics and Statistics
4.
(b)
Dependent variable
5.
(b)
Regression
6.
(d)
Galton
7.
(c)
Negative
8.
(c)
Correlation coefficient
9.
(d)
Both (a) and (b)
10.
(c)
Singular and Plural.
11.
(d)
12.
(c)
Long-term plan
13.
(a)
1950
14.
(c)
Industrial
15.
(a)
Controlling Plans
16.
(b)
People's Plan
17.
(c)
18.
(c)
Increase in output
19.
(a)
Vicious circle of poverty
20.
(b)
New welfare oriented approach
21.
Econometrics may be defined as the social science in which the tools of economic theory, mathematics and statistical inference are applied to the analysis of economic phenomena.
22.
23.
(i) Correlation is a statistical device that helps to analyse the covariation of two or more variables.
(ii) Correlation is the relationship between two or more variables which vary with the other in the same or the opposite direction.
24.
(i) Based on characteristics there are quantitative and qualitative data.
(ii) Qualitative data is classified as nominal data and rank data.
(iii) Based on the data sources there are primary data and secondary data.
25.
There are two major types of statistics.
(i) Descriptive statistics
(ii) Inferential statistics
26.
(i) National Institution for Transforming India was formed on January 1, 2015 through a Union Cabinet resolution replacing the Planning Commission.
(ii) Prime Minister is the Chairperson and Union Ministers Ex-officio members.
(iii) Vice-Chairman of NITI Aayog is the functional head.
27.
Basic and collective needs of the people - health, education, sanitation, water, food, housing facilities.
28.
Gross National Product is the total total market value of all final goods and services produced within a nation in a particular year, plus income earned by its citizens (abroad) minus income of non residents located in that country.
29.
1. Gross national product
2. GNP per capita
3. Welfare
4. Social indicators.
30.
Development must, therefore, be conceived as a multidimensional process involving major changes in social structures, popular attitudes and national institutions and acceleration of growth, the reduction of inequality and the eradication of absolute poverty.
Michael P. Todaro
31.
Central Statistical Office (CSO)
(i) It is responsible for co-ordination of statistical activities in the country and for evolving and maintaining statistical standards.
(ii) It compiles National Accounts, conducts Annual Survey of Industries and Economic Census, compiles Index of Industrial Production and Consumer Price Indices.
(iii) It deals with social statistics, training, international co-operation, Industrial Classification, etc.
National Sample Survey
Organisation
NSSO has four divisions:
(i) Survey Design and Research Division
(ii) Field Operations. Division
(iii) Data Processing Division
(iv) Co-ordination and Publication Division
The Programme Implementation Wing has 3 Divisions:
(i) Twenty Point Programme
(ii) Infrastructure Monitoring and Project Monitoring
(iii) Member of Parliament Local Area Development Scheme.
1. There is National Statistical Commission and one autonomous Institute, i.e., Indian Statistical Institute.
32.
(i) Models in Mathematical Economics are developed based on Economic Theories, while Econometric Models are developed based on Economic Theories to test the validity of Economic Theories in reality through the actual data.
(ii) Regression Analysis in Statistics does not concentrate more on error term while Econometric Models concentrate more on error terms
33.
(i) Besides verification it is used for the prediction of one value, in relation to the other given value.
(ii) Regression coefficient is an absolute figure. If we know the value of the independent variable, we can find the value of the dependent variable.
(iii) It has wider application, as it studies linear and nonlinear relationship between the variables.
(iv) It is widely used for further mathematical treatment.
34.
35.
(I) Statistics presents facts in a definite form.
(ii) It simplifies mass of figures.
(iii) It facilitates comparison.
(iv) It helps in formulating and testing.
(v) It helps in prediction.
(vi) It helps in the formulation of suitable policies.
36.
1. Co-operative and competitive federalism to enable the States to have active participation.
2. Shared national agenda for development priorities and strategies.
3. Decentralized planning to restructure the planning process into a bottom up model.
4. Vision and scenario planning to design medium and long-term plans.
5. Network of expertise
6. Harmonization of actions across different layers of government.
7. Conflict resolution for mutual consensus to intersectoral, inter departmental, inter state and centre state issues.
8. Coordinating interface with the world to harness global expertise and resources.
9. Internal consultancy to central and State governments on policy and programmes.
10. Capacity building and technology up-gradation and providing managerial and technical know how.
11. Monitoring and evaluation of policies and progammes.
37.
To accelerate and strengthen market mechanism:
1. The market mechanism works imperfectly because of ignorance and unfamiliarity with it.
2. There is non monetized sector, unorganized factor, product, money and capital markets.
3. Therefore a planned economy is a better substitute for free economy.
To remove unemployment:
1. Capital is scarce, labour abundant so there is unemployment and disguised unemployment in UDCs.
2. So planning is needed.
To achieve bàlanced development:
1. For rapid economic development UDC needs planning to develop agriculture, industrial, establish socio and economic overheads and expand domestic and foreign trade.
Development of agriculture and industries:
1. Reorganization of agriculture releases surplus labour force which is absorbed by the industrial sector.
2. Development of agriculture is essential to supply raw materials for industries.
Development of infrastructure:
1. Canals, roads, railways, power stations are needed for agriculture and industries.
2. These economic and social overheads need huge capital investment and have long gestation period and low rate of return.
3. Only the state can provide this through planning.
Development of money and capital market:
1. Planning alone can provide sound money market and capital market.
To remove poverty and inequalities:
1. Planning raises national and per capita income, reduces inequalities and poverty and increases employment opportunities.
38.
1. Sir M. Vishveshwarya (1934) made the first attempt in laying foundation for economic planning in India through his book, "Planned Economy of India". It was a 10 year plan.
2. Jawaharlal Nehru (1938) set-up "National Planning Commission" by a committee but due to the World War II it did not materialize.
3. In 1940,8 leading industrialists of Bombay presented a 15 Year Bombay Plan.
4. In 1944 S. N Agarwal gave the Gandhian Plan focusing on the agriculture and rural economy.
5. M.N. Roy in 1945 drafted People's Plan aiming at mechanisation of agricultural production.
6. In 1950 J.P. Narayan advocated Sarvodaya Plan which was inspired by Gandhian Plan and with the idea of Vinoba Bhave.
7. It gave importance to agriculture, small and cottage industries.
8. After considering all the plans in the same year Planning Commission was set up to formulate Five Year Plan in India by Jawaharlal Nehru.
9. Nehru was the first Chairman of Planning Commission, Government of India.
39.
Human Resources:
(i) Human power increases productivity and thus national income.
(ii) A healthy, educated and skilled labour force is the most important productive asset.
Technical Know-how:
(i) As the scientific and technological knowledge advances, more sophisticated techniques steadily raise the productivity in all sectors.
Political Freedom:
(i) Development is linked with political freedom.
(ii) Dadabhai Naoroji said the drain of wealth from India under British rule is the major cause of increase in poverty in India.
Social Organization:
(i) Mass participation in development programs is a pre condition for accelerating development
(ii) When some groups enjoy the benefits of growth and majority of the poor do not participate in the process of development it is called crony capitalism.
Corruption free administration:
(i) Tax evasion breeds corruption and prevents progress.
Desire for development:
(i) If the level of consciousness is low and the people have accepted poverty as their fate, there is little scope for development.
Moral, ethical and social values:
(i) If people are dishonest, market cannot function.
Casino Capitalism:
(i) If people spend larger propotion of their income on entertainment liquor, illegal activities, production suffers. This is called casino capitalism.
Patrimonial Capitalism:
(i) If assets are inherited by children, they would not work hard because they do not know the value of the assets. So, production is low.
40.
(i) The cause for vicious circle of poverty is demand and supply.
(ii) On the supply side, the low level of real income leads to low level of saving and investment and to deficiency of capital.
(iii) Deficiency of capital leads to low productivity and back to low income.
(iv) On the demand-side, low level of real income leads to low demand so investment is less, therefore deficiency of capital, low productivity and low income.
41.
Econometrics is the statistical and mathematical analysis of economic relationships, often serving as a basis for economic forecasting. It is used by economists to study relationships between economic variables Econometrics is interesting because it provides the tools to enable us to extract useful information about important economic policy issues from the available data. It is used to understand economic issues and test theories. Without evidence economic theories are abstract and has no bearing on reality. Econometrics is a set of tools we can use to confront theory with real world data. A study' could estimate a key parameter such as the price elasticity of demand for it or econometric techniques could be used to generate forecasts. It is used to develop, estimate and evaluate models which relate economic or financial variables.
42.
| S.No | X | X - X | (X - X)2 | Y | Y - Y | (Y - Y)2 | XY |
| 1 | 45 | -19.5 | 380.25 | 25 | -18.5 | 342.25 | 360.75 |
| 2 | 48 | -16.5 | 272.25 | 30 | -13.5 | 182.25 | 222.75 |
| 3 | 50 | -14.5 | 210.25 | 35 | -8.5 | 72.25 | 123.25 |
| 4 | 55 | -9.5 | 90..25 | 30 | -13.5 | 182.25 | 128.25 |
| 5 | 65 | 0.5 | 0.25 | 40 | -3.5 | 12.25 | -1.75 |
| 6 | 70 | 5.5 | 30.25 | 50 | 6.5 | 42.25 | 35.75 |
| 7 | 75 | 10.5 | 110.25 | 45 | 1.5 | 2.25 | 15.75 |
| 8 | 72 | 7.5 | 56.25 | 55 | 11.5 | 132.25 | 86.25 |
| 9 | 80 | 15.5 | 240.25 | 60 | 16.5 | 272.25 | 255.75 |
| 10 | 85 | 20.5 | 420.25 | 65 | 21.5 | 462.25 | 440.75 |
| 10 | 645 | 1810.50 | 435 | 1702.5 | 1667.5 |
\(\bar{X}=\frac{645}{10}=64.5
\)
\(\sigma x=\sqrt{\frac{\sum(x-\bar{x})^{2}}{n}}
\)
\(=\sqrt{\frac{1810.50}{10}}
\)
\(=\sqrt{181.05}=13.4
\)
\(\bar{\gamma}=\frac{435}{10}=43.5
\)
\(\sigma y=\sqrt{\frac{\sum(y-\bar{y})^{2}}{n}}
\)
\(=\sqrt{\frac{1702.5}{10}}=\sqrt{170.25}=13.05
\)
\(r=\frac{\sum x y^{\prime}}{\sqrt{\sum x^{2}} \sqrt{\sum y^{2}}}
\)
\(=\frac{1667.5}{\sqrt{1810.50} \sqrt{1702.5}}
\)
\(=\frac{1667.5}{42.55 \times 41.25}=\frac{1667}{1755}=0.95
\)
\(\bar{x} =64.5
\)
\(\bar{y} =43.5
\)
\(\sigma y =13.05
\)
\(\sigma x =13.4\)
r =0.95
The regression X on Y is
\(x-\bar{x} =r \times \frac{\sigma x}{\sigma y} \times(y-\bar{y})
\)
\(x-64.5 =0.95 \times\left(\frac{13.4}{13.05}\right) \times y-43.5 \)
x-64.5 =(0.95 x 1.03) x y-43.5
x =0.9785 x (y-43.5)+64.5
x =0.9785 y-42.56+64.5
x =0.9785 y+21.94
The regression Y on X is
\(y-\bar{y}=r \times \frac{v y}{\sigma x} \times(x-\bar{x})
\)
\(y-43.5=0.95 \times \frac{13.05}{13.4} \times x-64.5\)
y=0.95(0.97) x (x-64.5)+43.5
y=0.9215 x (x-64.5)+43.5
y=0.9215 x-59.44 + 43.5
Ans: y=0.9215 x-15.94
43.
44.
Nature of Statistics
(i) Different Statisticians and Economists differ in views about the nature of statistics.
(ii) Some call it a science and some say it is an art
(iii) Tippet considers Statistics both as a science as well as an art.
Scope of statistics
(i) Statistics is applied in every sphere of human activity social and physical.
Statistics and Economics
(i) Statistical data and techniques are immensely useful in solving many economic problems.
Statistics and Firms
(i) Statistics is used in many firms to find whether the product is conforming to specifications or not.
Statistics and Commerce
(i) Market survey helps to find the present conditions and to forecast the likely changes in future.
Statistics and Education
- Statistics is necessary for the formulation of policies to start new course.
- Public and private educational institutions do research and development work to test the past knowledge and evolving knowledge.
Statistics and Planning
(i) In the modern world, a "world of planning" almost all the organisations in the government are using planning for efficient working, for the formulation of policy decisions and execution of the same.
(ii) In India, statistics play an important role in planning both at the central and the state government levels, but the quality of data is highly unscientific.
Statistics and Medicine
(i) t-test is used to compare the efficiency of two medicines.
Statistics and Modern applications
(i) Recent developments in computer and information technology have enabled statistics to integrate their models and thus make statistics a part of decision making procedures of many organisations.
(ii) There are many software packages available for solving simulation problems.
45.
Introduction:
(i) Planning may retard private initiatives, hamper freedom of choice, involve huge cost of administration and stop automatic adjustment of price mechanism.
(i) Loss of freedom
1. Regulations and restrictions are the backbone of a planned economy.
2. Economic freedom consists of freedom of consumption, freedom of choice of occupation, freedom to produce and the freedom to fix prices for the products.
3. Under planning, crucial decisions are made by the Central Planning Authority.
4. The consumers, producers and the workers enjoy no freedom of choice.
5. Hayek in his book 'Road to Serfdom' explains that centralized planning leads to loss of personal freedom and ends in economic stagnation.
(ii) Elimination of Initiative
1. Planning follows routine proocedure and may cause stagnation in growth.
2. Absence of private ownership and profit discourages entrepreneurs from risk taking.
3. Attractive profit is the incentive for searching new ideas, new methods.
4. All enjoy equal reward under planned economy irrespective of their effort, efficiency.
5. So, nobody is interested in undertaking new and risky ventures.
6. The bureaucracy and red tapism cause procedural delay and time loss.
7. So, even socialist countries like Russia and China offer incentives to private firms.
(iii) High cost of Management
1. Plan formulation and implementation involve an army of staff for data collection and administration.
2. Lewis remarks, "The better we try to plan, the more planners we need".
3. Inadequate data, faulty estimations and improper implementation of plans result in wastage of resources and cause either surplus or shortages.
(iv) Difficulty in advance
calculations
1. Advance calculations in a precise manner is impossible with regard to consumption and production.
2. It is also difficult to put the calculations into practice under planning.
Conclusion
1. The arguments against planning are mostly concerned with centralized and totalitarian planning.
46.
47.
Natural Resource:
(i) The existence of natural resources in abundance is essential for development.
(ii) But Japan, though it lacks natural resources imports them and achieves faster rate of economic development with the help of technology.
Capital Formation:
(i) Capital formation refers to the net addition to the existing stock of capital goods which are either tangible (plants, machinery) or intangible (health, education).
(ii) Capital formation helps increase productivity of labour, production and income.
(iii) Advanced techniques of production can be used and leads to better utilization of natural resources, industrialization and expansion of markets which are essential for economic progress.
Size of the Market:
(i) Large size of the market would stimulate production, increase employment and raise the National per capita income.
Structural Change:
(ii) Structural change refers to change in the occupational structure of the economy.
(iii) Any economy is divided into primary secondary and tertiary sector.
(iv) Any economy which is predominantly agricultural remains backward.
Financial System:
(i) Financial system implies the existence of an efficient and organized banking system in the country.
(ii) There should be an organized money market to facilitate easy availability of capital.
Marketable Surplus:
(i) It refers to the total amount of farm output cultivated by farmers over and above their family consumption needs.
(ii) This surplus brings income, raises purchasing power, employment and output in other sectors.
Foreign Trade:
(i) A country with favorable balance of trade is always developed.
Economic System:
(i) A country with free market system enjoys better growth rate compared to controlled economies.

12th Standard Syllabus & Materials
12th Standard
TN 12th Computer Applications களப்பெயர் முறைமை (DNS) Sample Question Papers Study Material - QB365 Set A
NEW12th Standard
TN 12th Computer Applications வலையமைப்பு எடுத்துக்காட்டுகள் மற்றும் நெறிமுறைகள் Sample Question Papers Study Material - QB365 Set A
NEW12th Standard
TN 12th Computer Applications கணினி வலையமைப்பு ஓர் அறிமுகம் Sample Question Papers Study Material - QB365 Set A
NEW12th Standard
TN 12th Computer Applications PHP-உடன் MySQL-ஐ இணைத்தல் Sample Question Papers Study Material - QB365 Set A



Tamilnadu Stateboard 12th Standard Subjects

Maths

Chemistry

Physics

Biology

Computer Science

Business Maths and Statistics
Economics

Commerce

Accountancy

History

Computer Applications
Biology
Computer Technology
Computer Applications
Computer Science
Business Maths and Statistics
Commerce
Economics
Maths
Chemistry
Physics
Computer Technology
History
Accountancy

Tamil

English

French
Tamilnadu Stateboard Standards


