
7th Standard CBSE Syllabus & Materials
7th Standard CBSE
CBSE 7th Standard Science Wastewater Story Sample Question Papers Study Material - QB365
NEW7th Standard CBSE
CBSE 7th Standard Science Forests: Our Lifeline Sample Question Papers Study Material - QB365
NEW7th Standard CBSE
CBSE 7th Standard Science Water: A Precious Resource Sample Question Papers Study Material - QB365
NEW7th Standard CBSE
CBSE 7th Standard Science Light Sample Question Papers Study Material - QB365
NEW7th Standard CBSE
CBSE 7th Standard Science Electric Current and Effects Sample Question Papers Study Material - QB365 Set C
NEW7th Standard CBSE
CBSE 7th Standard Science Electric Current and Effects Sample Question Papers Study Material - QB365 Set B

Published on: 31/10/2025
Download CBSE Class 7th Standard CBSE Science question papers, sample papers, important questions, and previous year solved papers in PDF format. Get free study materials, NCERT solutions, and exam preparation resources for Class 7th Standard CBSE Science
Questions + Answers key
Take MCQ Science Test
1.
Two railway stations are 320 km apart from each other. Train-I covers this distance in 4.5 hours whereas train-If reaches the destination 10 minutes earlier, through it departs the station 20 minutes later.
Based on this information answer the following questions:
(i) What might be the reason that the train-If reaches the destination earlier?
(ii) Calculate the speed of both the trains.
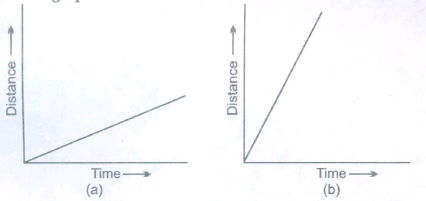
(iii) If we consider that both the trains move with constant speed, then assign one distance-time graph for each train.
2.
(a) Define speed
(b) The distance between Delhi and Agra is 270 km. A train takes 3 hours to cover the distance. Calculate the speed of train.
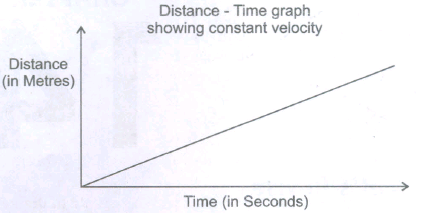
(c) Show the shape of distance-time graph for a vehicle moving with a constant speed.
3.
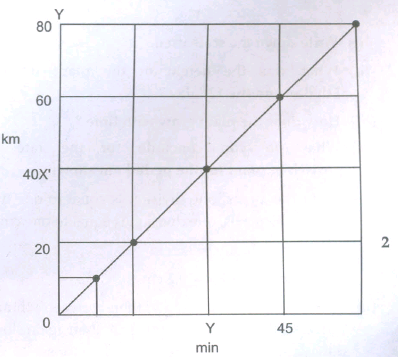
Describe steps to construct a graph using the data given in the following table
| S.No | Time (minutes) | Distance (km) |
|---|---|---|
| 1 | 0 | 0 |
| 2 | 5 | 606 |
| 3 | 15 | 20 |
| 4 | 30 | 40 |
| 5 | 45 | 60 |
| 6 | 60 | 80 |
4.
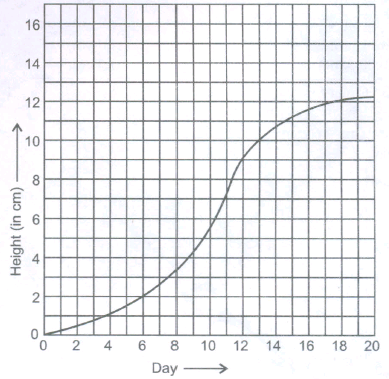
Aman made a graph to show the relationship between the speed of a car and time
Look at the graph and answer the following questions:
(i) What has Aman shown on each axis?
(ii) What is the scale of the graph?
(iii) What is the speed of the car at 3.30 minutes?
(iv) What distance is covered by the car in 4 minutes?
(v) At what time the car has assumed constant speed?
5.
The graph given below shows the increase in the height of plant with time
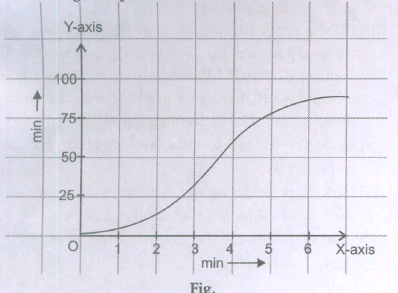
(i) Write down the scale used.
(ii) What was the height of the plant on the 5th day and the 12th day?
(iii) How does the plant grow with time ?
(iv) What do you conclude for. the rate of growth of plant for the period not shown ?
6.
The given data regarding the motion of two different objects C and 0 is in a tabular form. Check them carefully and state whether the motion of the objects is uniform or non-uniform.
| Time | Distance travelled bye (in m) | Distance travelled by D (in m) |
| 9:30 AM | 10 | 12 |
| 9:45 AM | 20 | 19 |
| 10:00 AM | 30 | 23 |
| 10:15 AM | 40 | 35 |
| 10:30 AM | 50 | 37 |
| 10:45 AM | 60 | 41 |
| 11:00 AM | 70 | 44 |
7.
Distance between Bholu's and Golu's house is 9 km. Bholu has to attend Golu's birthday party at 7 0' clock. He started his journey from his home at 6 0' clock on his bicycle and covered a distance of 6 km in 40 min. At that point, he met Chintu and he spoke to him for 5 min and reached Golu's birthday party at 7 0' clock. With what speed, did he cover the second part of the journey? Calculate his average speed for the entire journey.
8.
Explain by giving example that how can we choose a suitable scale.
9.
Boojho goes to the football ground to play football. The distance-time graph of his journey from his home to the ground is given as figure.
(a) What does the graph between points B and C indicate about the motion of Boojho?
(b) Is the motion between 0 to 4 min uniform or non-uniform?
(c) What is his speed between 8 to 12 min of his journey.
10.
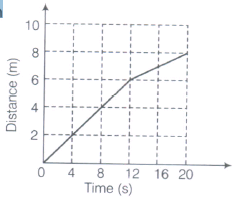
Given below as a figure is the distance-time graph of the motion of an
(a) What will be the position of the object at 20 s?
(b) What will be the distance travelled by the object in 12 s?
(c) What is the average speed ofthe object?
1.
(i) Train-II might have gone in higher speed then the train-I as it takes less time to cover the same distance.
(ii) For train - I
Distance = 320 km
Time taken = 4 h 30 mins
= \(4\frac { 1 }{ 2 } \)
Speed = \(\frac { distance }{ Time } \)
\(\frac { 320 }{ 9/2 } km/h\)
= \(\frac { 320\times 2 }{ 9 } =\frac { 640 }{ 9 } \)
= 71.1 km.h
For train - II
Distance = 320km
Time taken = 30 mins less than the first train
=4h
Speed = \(\frac { Distance }{ Time } \)
= \(\frac { 320 }{ 4 } km/h\)
=80 km/h
(iii) The graph in figure (a) is of train-I
The graph in figure (b) is of train-II.
2.
(a) The total distance covered in given interval of time is known as speed.
(b) Distance between Delhi & Agra = 270 km
Time taken by Train = 3 hours
Speed = Distance / Time
= 270/3 = 90 Km/hr.
(c) Distance - Time graph
3.
The following steps may be followed:
(i) Draw two perpendicular lines to represent the two axis and mark them OX and OY. O is the intersection of the two axis
(ii) Decide the quantity to be shown along the x-axis and that to be shown along the y-axis. From the given data, we are measuring distance at given intervals of time. So time is to be shown along x-axis distance along y-axis
(iii) Choose a scale to represent the given data. Suppose we have 4 squares (or 40 divisions) along x-axis and 4 squares (or 40 divisions along y-axis. Along x-axis we can take 10 divisions equal to 15min and along y-axis we can take 10 divisions equal to 20 km.
(iv) Mark the values of time and distance on the respective axis.
(v) Now mark points on the graph paper to represent each set of values for distance and time.
(vi) Join all points on the graph. Graph obtained is shown below:
4.
(i) Time in minutes on x-axis and speed in m/min on y-axis.
(ii) On x-axis, 10 divisions = 1 min and on y-axis 10 divisions = 25 m/min
(iii) At 3.30 minutes, the speed of car is 30 m/min.
(iv) Distance at 4 min = Speed x Time = 52.5 x 4 = 210.0 m
(v) After 6.30 minutes the car has assumed constant speed.
5.
(i) On the x-axis, one division is equal to one day and on the y-axis, one division is equal to one cm.
(ii) Height on 5th day = 1.2cm
Height on 12th day = 9.2 cm
(iii) Initially the growth is slow, then between 9th and 11th day, the increase is quite fast, then again slows down and after 12th day the growth stops.
(iv) It appears period now shown, i.e., after 20th day the rate of growth is nil
6.
We can check the motion of the objects C and 0 by plotting the distance-time graph for the two objects .
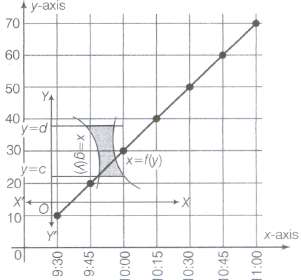
Graph for object C on x-axis
Scale 1 cm = 15 min and on y-axis 1 cm = 10 m
Since, the distance-time graph of the object C is a straight line. Therefore, its motion is uniform.
Graph of object D
Scale On x-axis, 1cm = 15min, On y-axis 1cm =5 m
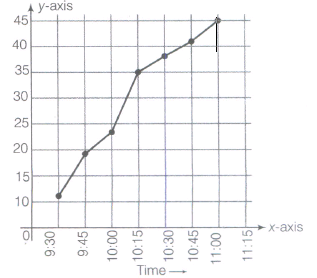
Since, the distance-time graph of the object 0 is not a straight line, therefore, its motion is non-uniform.
7.
From the question, Bholu covers 3 km distance in 15 min
speed of Bholu \(=\frac{3}{15}\times60=12\ km/h\) \((1\ min=\frac{1}{60}h)\)
Now, average speed is given by
\(=\frac{Total\ distance\ travelled}{Total\ time\ taken}=\frac{9}{1}=9\ km/h\)
8.
While choosing the most suitable scale for drawing a graph, we should keep the following points in mind
(i) The difference between the highest and lowest values of each quantity.
(ii) The intermediate values of each quantity so that with the scale chosen, it is easy to mark the values on the graph.
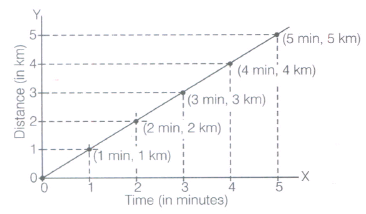
(iii) To utilise the maximum part of the paper on which the graph is to be drawn, assume that we have a graph paper of size 25 cm \(\times\) 25 cm and we have to accommodate following data:
| Tim (AM) | Odometer reading | Distance from the starting point |
| 8:00 AM | 36540 km | 0 km |
| 8:30 AM | 36560 km | 20 km |
| 9:00 AM | 36580 km | 40 km |
| 9:30 AM | 36600 km | 60 km |
| 10:00 AM | 36620 km | 80 km |
Since, one of the scales will be
Distance 5 km = 1 cm and Time 6 min = 1 cm
9.
(a) Since, the graph between B and C is parallel to time-axis, so it indicates that Boojho is at rest.
(b) Since, the graph is not straight line, so it is a non-uniform motion.
\(Speed=\frac{Distance}{Time}=\frac{225-150}{12-8}=\frac{75}{4}=18.75\ m/min\)
10.
(a) From the graph, it is clear that the distance at 20 s is 8 m.
(b) Distance travelled by the body object in 12 s is 6 m.
(c) \(Average\ speed=\frac{Total\ distance}{Total\ time}=\frac{8}{20}=0.4m/s\)

7th Standard CBSE Syllabus & Materials
7th Standard CBSE
CBSE 7th Standard Science Electric Current and Effects Sample Question Papers Study Material - QB365 Set A
NEW7th Standard CBSE
CBSE 7th Standard Science Motion and Time Sample Question Papers Study Material - QB365 Set D
NEW7th Standard CBSE
CBSE 7th Standard Science Motion and Time Sample Question Papers Study Material - QB365 Set C



NCERT Books

Syllabus

Exam Pattern

Sample Question Papers

Previous year Question Papers

Important Notes

MCQ Practice test

NCERT Exemplers

Case study Questions

Image Based Questions

Passage based Questions

HOT Questions

Value Based Questions

Model Questions Papers
NCERT ( Book Back ) Questions

Assertion and Reason
Important Questions And Answers

CBSE 7th Standard CBSE Subjects
CBSE Standards