
9th Standard CBSE Syllabus & Materials
9th Standard CBSE
CBSE 9th Standard Mathematics Statistics Sample Question Papers Study Material - QB365 Set D
NEW9th Standard CBSE
CBSE 9th Standard Mathematics Statistics Sample Question Papers Study Material - QB365 Set C
NEW9th Standard CBSE
CBSE 9th Standard Mathematics Statistics Sample Question Papers Study Material - QB365 Set B
NEW9th Standard CBSE
CBSE 9th Standard Mathematics Surface Areas and Volumes Sample Question Papers Study Material - QB365 Set D
NEW9th Standard CBSE
CBSE 9th Standard Mathematics Surface Areas and Volumes Sample Question Papers Study Material - QB365 Set C
NEW9th Standard CBSE
CBSE 9th Standard Mathematics Surface Areas and Volumes Sample Question Papers Study Material - QB365 Set B

Published on: 29/10/2025
Download CBSE Class 9th Standard CBSE Mathematics question papers, sample papers, important questions, and previous year solved papers in PDF format. Get free study materials, NCERT solutions, and exam preparation resources for Class 9th Standard CBSE Mathematics
Questions + Answers key
Take MCQ Mathematics Test
1.
The % of marks obtained by students in the annual examination of a class in mathematics are given below:
| Percentage of marks | No. of students |
|---|---|
| 0-10 | 8 |
| 10-30 | 32 |
| 30-45 | 18 |
| 45-50 | 10 |
(i) How many students get less than 30% of marks?
(ii) Represent the data by histogram.
(iii) Which value is depicted by a student Ram obtaining the highest marks in the interval 45-50?
2.
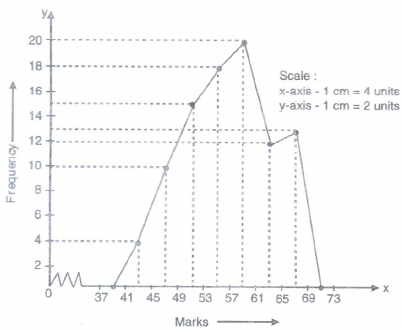
Represent the following data by means of a frequency polygon.
| Marks | Frequency |
|---|---|
| 41-45 | 4 |
| 45-49 | 10 |
| 49-53 | 15 |
| 53-57 | 18 |
| 57-61 | 20 |
| 61-65 | 12 |
| 65-69 | 13 |
3.
Survey on the playing children of various age group is:
| Age(in yrs) | No. of Children |
| 1-2 | 5 |
| 2-3 | 3 |
| 3-5 | 6 |
| 5-7 | 12 |
| 7-10 | 9 |
| 10-15 | 10 |
| 15-17 | 4 |
Draw the histogram of above data
4.
A survey conducted by an organisation for the cause of illness and death among the women between the ages 15 - 44 (in years) worldwide, found the following figures (in %):
| S.No. | Causes | Female fatality rate (%) |
| 1. | Reproductive health conditions | 31.8 |
| 2. | Neuropstchiatric conditions | 25.4 |
| 3. | Injuries | 12.4 |
| 4. | Cardiovascular conditions | 4.3 |
| 5. | Respiratory conditons | 4.1 |
| 6. | Other causes | 22.0 |
(i) Represent the information given above graphically.
(ii) Which condition is the major cause of women's ill health and death worldwide?
(iii) Try to find out, with the help of your teacher, any two factors which play a major role in the cause in (ii) above being the major cause.
5.
The following observations have been arranged in ascending order. If the median of the data in 65, find the value of x.
32,35,50,51,x,x+2,73,76,83,90
6.
Arithmetic mean of terms 21,16,24,x,29,15 is 23. Find this value of x.
7.
The mean of 10,12,18,13,x and 17 is 15. Find the value of x.
8.
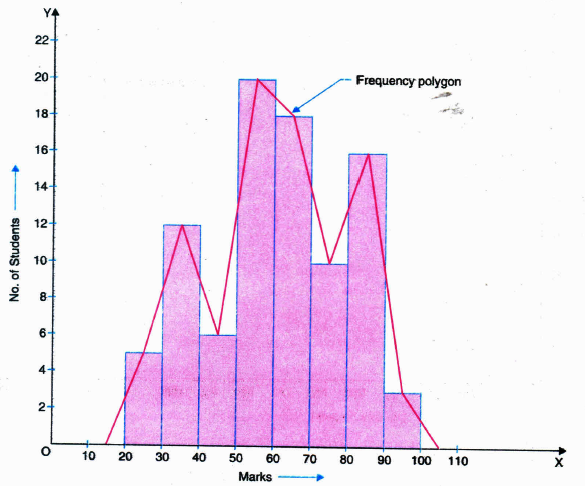
Draw a histogram and frequency polygon of the following data:
| Marks | No.of students |
|---|---|
| 20-30 | 5 |
| 30-40 | 12 |
| 40-50 | 6 |
| 50-60 | 20 |
| 60-70 | 18 |
| 70-80 | 10 |
| 80-90 | 16 |
| 90-100 | 3 |
9.
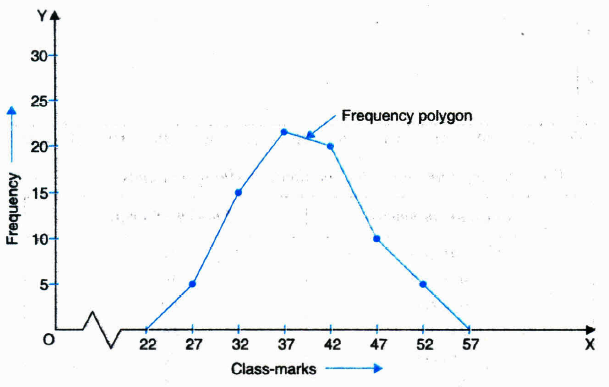
Draw a frequency polygon to represent the following information:
| Class | Frequency |
|---|---|
| 25-29 | 5 |
| 30-34 | 15 |
| 35-39 | 23 |
| 40-44 | 20 |
| 45-49 | 10 |
| 50-54 | 7 |
10.
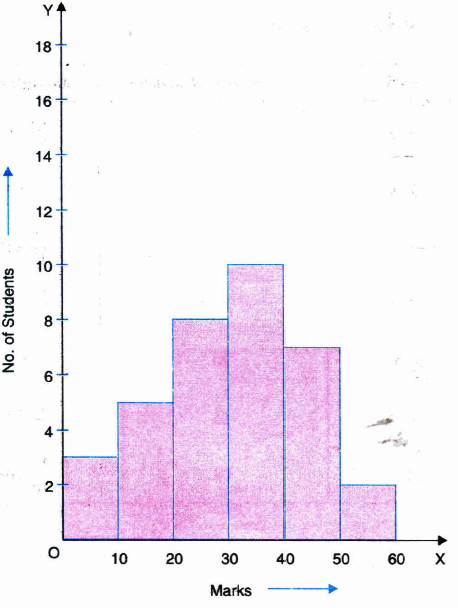
Draw a histogram representing the following frequency distribution:
| Marks | No. of students |
| 0-10 | 3 |
| 10-20 | 5 |
| 20-30 | 8 |
| 30-40 | 10 |
| 40-50 | 7 |
| 50-60 | 2 |
1.
(i) Required number of students = 8 + 32 = 40
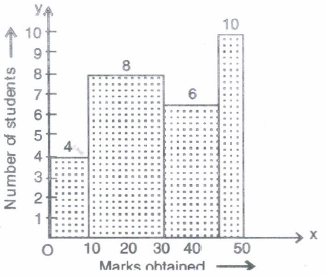
(ii) Here, We notice that classes are continuous but class-size is not the same for all the classes. We notice minimum class-size is of class 45-50, i.e., 5. We will first find proportionate length of rectangle (adjusted frequency) for each class.
Length of rectangle (adjusted frequency) =\(\frac { Frequency\ of\ Class }{ Width\ of\ class } \times Minimum\ class-size\)
| Marks (C.I.) |
Number of students(f) | Width of class (Clss-size) |
Length of rectangle |
|---|---|---|---|
| 0-10 | 8 | 10 | \(\frac{8}{10}\)x 5 = 4 |
| 10-30 | 32 | 20 | \(\frac{32}{20}\) x 5 = 8 |
| 30-45 | 18 | 15 | \(\frac{18}{15}\) x 5 = 6 |
| 45-50 | 10 | 5 | \(\frac{10}{5}\) x 5 = 10 |
Now, we construct rectangles with respective class-intervals as widths and adjusted frequencies as heights.
Histogram representing marks obtained by students in unit test of Mathematics.
(iii) Hardwork and Dilligence.
2.
| Marks | Frequency | Class Marks |
|---|---|---|
| 37-41 | 0 | 39 |
| 41-45 | 4 | 43 |
| 45-49 | 10 | 47 |
| 49-53 | 15 | 51 |
| 53-57 | 18 | 55 |
| 57-61 | 20 | 59 |
| 61-65 | 12 | 53 |
| 65-69 | 13 | 67 |
| 69-73 | 0 | 71 |
3.
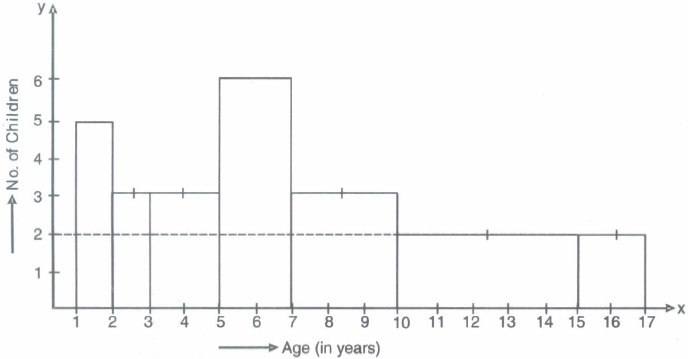
| Age(in years) | No. of children | Width of class | Length of rectangle |
|---|---|---|---|
| 1-2 | 5 | 1 | \(\frac{5}{1}\)x1=5 |
| 2-3 | 3 | 1 | \(\frac{3}{1}\)x1=3 |
| 3-5 | 6 | 2 | \(\frac{6}{2}\)x1=3 |
| 5-7 | 12 | 2 | \(\frac{12}{2}\)x1=6 |
| 7-10 | 9 | 3 | \(\frac{9}{3}\)x1=3 |
| 10-15 | 10 | 5 | \(\frac{10}{5}\)x1=2 |
| 15-17 | 4 | 2 | \(\frac{4}{2}\)x1=2 |
Required histogram is as follows:
4.
(i)
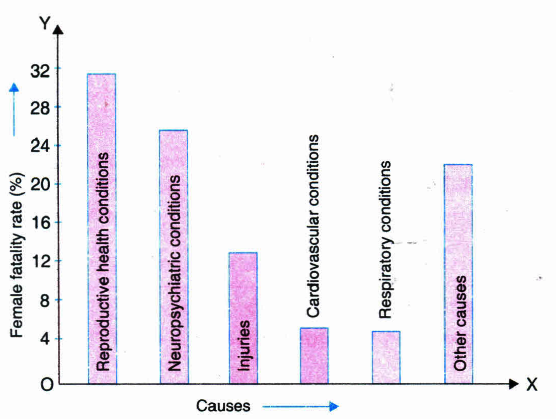
(ii) Reproduce health conditions is the major cause of women's ill health and death worldwide.
(ii) Lack of proper diet, lack of advised exercises.
5.
Number of observations (n) = 10, which is even,
\(\therefore\) Median
\(=\frac { { \left( \frac { n }{ 2 } \right) }^{ th }observation+{ \left( \frac { n }{ 2 } +1 \right) }^{ th }observation }{ 2 } \)
\(\Rightarrow 65=\frac { 5^{ th }observation+6^{ th }observation }{ 2 } \)
\(\Rightarrow\) \(65 = \frac {x+\left(x+2\right)}{2}\)
\(\Rightarrow\) 2x + 2 = 130
\(\Rightarrow\) 2x = 130 - 2 = 128
\(\Rightarrow\) \(x = \frac {128}{2}=64\)
6.
According to the question,
\(\frac {21+16+21+x+29+15}{6}=23\)
\(\Rightarrow\) 105 + x = 138
\(\Rightarrow\) x = 33
7.
According to the question,
\(\frac {10+12+18+13+x+17}{6}=15\)
\(\Rightarrow\) x + 70 = 90
\(\Rightarrow\) x = 20
8.
9.
We shall first make the class intervals continuous. Then, the modified table is as follows:
| Class | Class-marks | Frequency |
|---|---|---|
| 24.5-29.5 | 27 | 5 |
| 29.5-34.5 | 32 | 15 |
| 34.5-39.5 | 37 | 23 |
| 39.5-44.5 | 42 | 20 |
| 44.5-49.5 | 47 | 10 |
| 49.5-54.5 | 52 | 7 |
| Total | 80 |
10.

9th Standard CBSE Syllabus & Materials
9th Standard CBSE
CBSE 9th Standard Mathematics Surface Areas and Volumes Sample Question Papers Study Material - QB365 Set A
NEW9th Standard CBSE
CBSE 9th Standard Mathematics Heron's Formula Sample Question Papers Study Material - QB365 Set D
NEW9th Standard CBSE
CBSE 9th Standard Mathematics Heron's Formula Sample Question Papers Study Material - QB365 Set C



NCERT Books

Syllabus

Exam Pattern

Sample Question Papers

Previous year Question Papers

Important Notes

MCQ Practice test

NCERT Exemplers

Case study Questions

Image Based Questions

Passage based Questions

HOT Questions

Value Based Questions

Model Questions Papers
NCERT ( Book Back ) Questions

Assertion and Reason
Important Questions And Answers

CBSE 9th Standard CBSE Subjects
CBSE Standards