
9th Standard CBSE Syllabus & Materials
9th Standard CBSE
CBSE 9th Standard Mathematics Statistics Sample Question Papers Study Material - QB365 Set D
NEW9th Standard CBSE
CBSE 9th Standard Mathematics Statistics Sample Question Papers Study Material - QB365 Set C
NEW9th Standard CBSE
CBSE 9th Standard Mathematics Statistics Sample Question Papers Study Material - QB365 Set A
NEW9th Standard CBSE
CBSE 9th Standard Mathematics Surface Areas and Volumes Sample Question Papers Study Material - QB365 Set D
NEW9th Standard CBSE
CBSE 9th Standard Mathematics Surface Areas and Volumes Sample Question Papers Study Material - QB365 Set C
NEW9th Standard CBSE
CBSE 9th Standard Mathematics Surface Areas and Volumes Sample Question Papers Study Material - QB365 Set B

Published on: 29/10/2025
Download CBSE Class 9th Standard CBSE Mathematics question papers, sample papers, important questions, and previous year solved papers in PDF format. Get free study materials, NCERT solutions, and exam preparation resources for Class 9th Standard CBSE Mathematics
Questions + Answers key
Take MCQ Mathematics Test
1.
The following table gives the life times of 400 neon lamps:
| Lifetime (in years) | Number of Lamps |
|---|---|
| 300-400 | 14 |
| 400-500 | 56 |
| 500-600 | 60 |
| 600-700 | 86 |
| 700-800 | 74 |
| 800-900 | 62 |
| 900-1000 | 48 |
(i) Represent the given information with the help of a histogram.
(ii) How many lamps have a life time of more than 700 hours?
2.
The class marks of a frequency distribution are 104, 114, 124, 134, 144, 154, 164. Find the class size and class intervals.
3.
The mean of 100 observations is 60. If one observation of 50 is replaced by 110, then what will be the new mean?
4.
5 people were asking about the time in a week they spend in doing social work in their community. They said 10,7,13,20 and 15 hours, respectively. Find the mean (or average) time in a week denoted by them social work
5.
The marks obtained by 40 students of class IX in an examination are given below:
| 18 | 16 | 16 | 12 | 3 | 15 | 21 | 7 |
| 8 | 12 | 23 | 9 | 5 | 20 | 16 | 3 |
| 12 | 5 | 2 | 7 | 13 | 24 | 13 | 18 |
| 6 | 23 | 10 | 6 | 21 | 1 | 18 | 17 |
| 8 | 2 | 20 | 5 | 13 | 7 | 23 | 16 |
Present the data in the form of a frequency distribution using equal class-size, one such class being 10-15 (15 not included.)
6.
Thirty children spent about the number of hours they watched TV programs in the previous week. The result was as follow:
| 1 | 2 | 10 | 10 | 8 | 4 |
| 10 | 2 | 5 | 8 | 9 | 8 |
| 3 | 4 | 5 | 6 | 1 | 4 |
| 6 | 8 | 2 | 5 | 8 | 6 |
| 3 | 3 | 9 | 10 | 4 | 8 |
(i) Prepare a frequency table for the data given.
(ii) Find the mode of the data.
7.
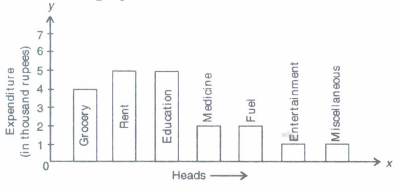
A family with a monthly income of Rs. 20,000 had planned the following expenditure per month under various heads.
| Heads | Expenditure (in thousand rupees) |
| Grocery | 04 |
| Rent | 05 |
| Education | 05 |
| Medicine | 02 |
| Fuel | 02 |
| Entertainment | 01 |
| Miscellaneous | 01 |
Draw a bar graph for the data above
8.
For a particular year, following is the distribution of ages (in hours) of primary school teachers in a particular state.
| Age (in years) | No. of teachers |
|---|---|
| Less than 20 | 11 |
| 21-25 | 32 |
| 26-30 | 51 |
| 31-35 | 49 |
| 36-40 | 27 |
| 41-45 | 6 |
| 46-50 | 4 |
1. Determine the class limits of the fourth class.
2. What is the class size?
3. Construct a cumulative frequency table.
9.
Represent the following data by means of histogram.
| Weekly wages (in Rs) | No. of workers |
|---|---|
| 1000-1100 | 5 |
| 1100-1200 | 7 |
| 1200-1350 | 6 |
| 1350-1450 | 2 |
| 1450-1700 | 10 |
| 1700-1900 | 6 |
10.
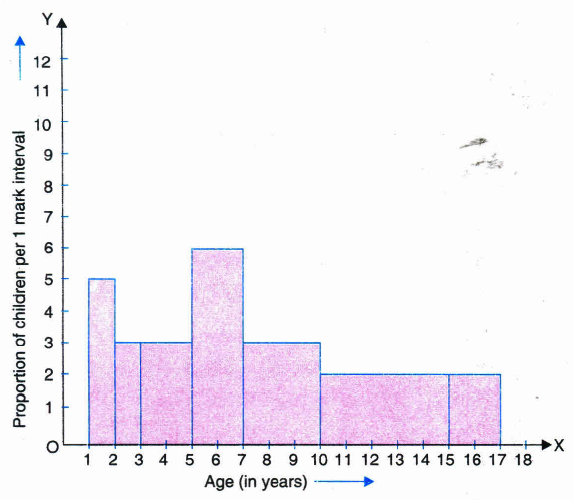
A random survey of the number of children of various age groups playing in a park was found as follows:
| Age (in years) | Number of children |
| 1-2 | 5 |
| 2-3 | 3 |
| 3-5 | 6 |
| 5-7 | 12 |
| 7-10 | 9 |
| 10-15 | 10 |
| 15-17 | 4 |
Draw a histogram to represent the data above.
11.
Median of given data is: 144,145,147,148,149,150,152,155,160
148
149
150
160
12.
If the median of the following data arranged in ascending order is 18, then the value of x is 8 11 12 16 16+x 20 25 30
1
2
3
4
13.
If the mean of 5,10,15,p,20,35,40 is 21. Then the value of p is
18
22
25
30
14.
Find the mean of all possible factors of 10.
4
4.5
12
15.
15.
Two consecutive class marks of a distribution are 52 and 57. Then the class size is:
2.5
5
54.5
109
16.
Class mark of a class interval 15 - 25 is:
10
20
40
5
17.
The upper limit of the class 36 - 40 is
36
38
40
41.
18.
The lower limit of the class 31-35 is
31
33
35
30
19.
Facts or information collected with a definite purpose are called:
Median
Mode
Data
Histogram
20.
The word 'Latum' is a
Latin word
German word
English word
Sanskrit word
21.
The points scored by a basketball team in a series of matches are as follows: 17,2,7,17,25,514,18,10. Find range.
22.
Find the mean of first six odd numbers.
23.
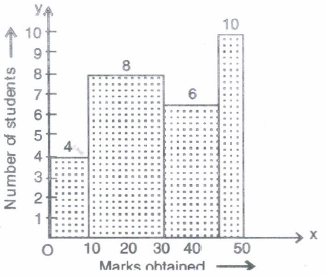
The % of marks obtained by students in the annual examination of a class in mathematics are given below:
| Percentage of marks | No. of students |
|---|---|
| 0-10 | 8 |
| 10-30 | 32 |
| 30-45 | 18 |
| 45-50 | 10 |
(i) How many students get less than 30% of marks?
(ii) Represent the data by histogram.
(iii) Which value is depicted by a student Ram obtaining the highest marks in the interval 45-50?
1.
| Lifetime (in yours) | Class Marks | Number of lapms (frequency) |
|---|---|---|
| 300-400 | 350 | 14 |
| 400-500 | 450 | 56 |
| 500-600 | 550 | 60 |
| 600-700 | 650 | 86 |
| 700-800 | 750 | 74 |
| 800-900 | 850 | 62 |
| 900-1000 | 950 | 48 |
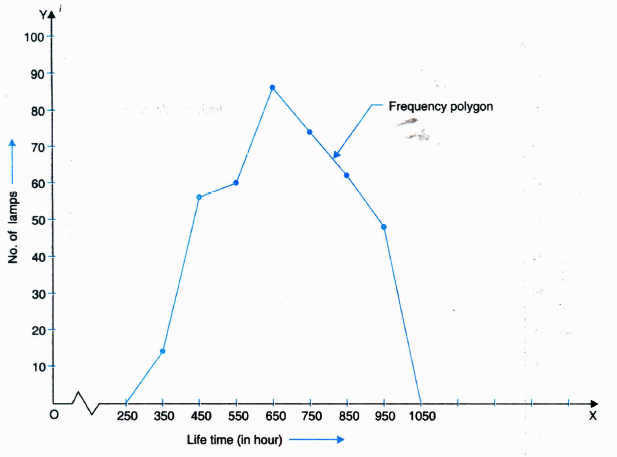
(ii) 74 + 62 + 48 = 184 have a life time of more than 700 hours
2.
Class size = 114 -104 = 10
\(\frac {10}{2}=5\)
The class intervals are
104-5___104+5, i.e., 99-109;
114-5___ 114+5, i.e, 109-119;
124-5___ 124+5, i.e., 119-129;
134-5___ 134+5, i.e., 129-139;
144-5___ 144+5, i.e., 139-149;
154-5___ 154+5, i.e., 149-159;
164-5___ 159-169.
3.
60.6
4.
13 hours.
5.
| 0-5 | 5 |
| 5-10 | 11 |
| 10-15 | 7 |
| 15-20 | 9 |
| 20-25 | 8 |
6.
(i) Frequency Table:
| No. of hours | Tally Marks | No.of students |
|---|---|---|
| 1 | II | 2 |
| 2 | III | 3 |
| 3 | III | 3 |
| 4 | IIII | 4 |
| 5 | III | 3 |
| 6 | III | 3 |
| 8 | III I | 6 |
| 9 | II | 2 |
| 10 | IIII | 4 |
| Total | 30 |
(ii) Mode = 8, as 8 occurs maximum number of times i.e., 6 times.
7.
8.
1. 30.5-35.5;
2.1;
3.
| Less than 20 | 11 |
| Less than 25 | 43 |
| Less than 30 | 94 |
| Less than 35 | 143 |
| Less than 40 | 170 |
| Less than 45 | 176 |
| Less than 50 | 180 |
9.
Hint
| Weekly wages (in Rs) | No. of workers (frequency) | Adjusted frequency |
|---|---|---|
| 1000-1100 | 5 | \(\frac {100}{100}\times 5\) |
| 1100-120 | 7 | \(\frac {100}{100}\times 7\) |
| 12001350 | 6 | \(\frac {100}{150}\times 6\) |
| 1350-1450 | 2 | \(\frac {100}{100}\times 2\) |
| 1450-1700 | 10 | \(\frac {100}{250}\times 10\) |
| 1700-1900 | 6 | \(\frac {100}{200}\times 6\) |
10.
Modified Table
[Minimum class-size = 1]
| Age (in years) | Number of children (frequency) | Width of the class | Length of the rectangle |
| 1-2 | 5 | 1 | \(\frac {5}{1}\times 1 = 5\) |
| 2-3 | 3 | 1 | \(\frac {3}{1}\times 1 = 3\) |
| 3-5 | 6 | 2 | \(\frac {6}{2}\times 1 = 3\) |
| Age (in years) | Number of children (frequency) | Width of the class | Length of the rectangle |
| 5-7 | 12 | 2 | \(\frac {12}{2}\times 1 = 6\) |
| 7-10 | 9 | 3 | \(\frac {9}{3}\times 1 = 3\) |
| 10-15 | 10 | 5 | \(\frac {10}{5}\times 1 = 2\) |
| 15-17 | 4 | 2 | \(\frac {4}{2}\times 1 = 2\) |
11.
Data are in ascending order
n = 9(odd)
Median = 9 + 1/2 th observation
12.
(d)
4
13.
\(\frac{5+10+15+p+20+35+40}{7}=21\)
\(\Rightarrow\) p = 22.
14.
All possible factors of 10 are 1,2,5 and 10. \(\overset{-}{x}=\frac{1+2+5+10}{4}=4.5.\)
15.
Class size = 57 - 52 = 5
16.
Class mark \(= \frac {15+25}{2}=20\)
17.
(c)
40
18.
Sixth class is 25 - 30.
19.
Definition of data.
20.
(a)
Latin word
21.
()
Range = highest point-lowest point
= 27 - 2 = 25
22.
()
Mean = \(\frac{1+3+5+7+9+11}{6}\)=\(\frac{36}{6}\)
= 6
23.
(i) Required number of students = 8 + 32 = 40
(ii) Here, We notice that classes are continuous but class-size is not the same for all the classes. We notice minimum class-size is of class 45-50, i.e., 5. We will first find proportionate length of rectangle (adjusted frequency) for each class.
Length of rectangle (adjusted frequency) =\(\frac { Frequency\ of\ Class }{ Width\ of\ class } \times Minimum\ class-size\)
| Marks (C.I.) |
Number of students(f) | Width of class (Clss-size) |
Length of rectangle |
|---|---|---|---|
| 0-10 | 8 | 10 | \(\frac{8}{10}\)x 5 = 4 |
| 10-30 | 32 | 20 | \(\frac{32}{20}\) x 5 = 8 |
| 30-45 | 18 | 15 | \(\frac{18}{15}\) x 5 = 6 |
| 45-50 | 10 | 5 | \(\frac{10}{5}\) x 5 = 10 |
Now, we construct rectangles with respective class-intervals as widths and adjusted frequencies as heights.
Histogram representing marks obtained by students in unit test of Mathematics.
(iii) Hardwork and Dilligence.

9th Standard CBSE Syllabus & Materials
9th Standard CBSE
CBSE 9th Standard Mathematics Surface Areas and Volumes Sample Question Papers Study Material - QB365 Set A
NEW9th Standard CBSE
CBSE 9th Standard Mathematics Heron's Formula Sample Question Papers Study Material - QB365 Set D
NEW9th Standard CBSE
CBSE 9th Standard Mathematics Heron's Formula Sample Question Papers Study Material - QB365 Set C


NCERT Books

Syllabus

Exam Pattern

Sample Question Papers

Previous year Question Papers

Important Notes

MCQ Practice test

NCERT Exemplers

Case study Questions

Image Based Questions

Passage based Questions

HOT Questions

Value Based Questions

Model Questions Papers
NCERT ( Book Back ) Questions

Assertion and Reason
Important Questions And Answers

CBSE 9th Standard CBSE Subjects
CBSE Standards